
Everything you need to know about market volatility
What is market volatility?
Stock market volatility measures how much the stock market’s overall value moves up and down. This also applies to individual stocks or bonds, whose underlying prices can also fluctuate. The most common way to calculate volatility is by measuring how much an asset’s price varies from its average price over a period of time. Standard deviation is the statistical measure most often used to represent volatility.
What causes market volatility?
Stock markets often become volatile when external events create uncertainty. Major stock indexes like the S&P/TSX Composite Index typically don’t move more than 1% in a single day. However, such indexes routinely rose and fell by more than 3% each day during the beginning of the COVID-19 pandemic in 2020. When such external events occur, investors don’t know what will happen, and the uncertainty can lead to frantic buying and selling.
Volatile markets are commonly attributed to things such as economic releases, company news, the opinion of well-known stock analysts or unexpected earnings results. Some market watchers also blame volatility on day traders, short-sellers and high-frequency trading firms.
Are market downturns normal?
Yes. Stock market downturns are normal and, as mentioned above, they can be caused by numerous factors. Anyone with an internet connection can look up how long crashes, corrections and bear markets have lasted. (A stock market crash is a fast and usual unexpected drop in stock prices. A “correction” generally refers to the price of an asset falling more than 10% from its most recent peak. This can also apply to the stock market as a whole. A bear market is typically a situation in which stock prices fall 20% or more from recent peaks.) However, nobody knows the timing, nature and magnitude of these market downturns.
When will the stock market turn around?
The short answer is, nobody knows. If you did, you could probably make a lot of money. Of course, there are things investors will watch for that may offer clues about the market’s direction. One item that will garner a lot of attention is whether central banks around the world will raise interest rates; hints about such moves could come in economic reports or in comments from officials who work at central banks. Other economic indicators investors watch for include retail sales and activity in the housing sector, such as housing starts and existing home sales.
What is important to remember is that history teaches us that stock markets will not keep falling forever.
Inflation vs. interest rates
What is inflation?
Inflation measures how much prices for goods and services are rising. Many factors affect prices: how hard a product is to find, the costs of labour and raw materials and competition among businesses selling goods and services. Policies to stimulate economic growth can cause inflation, too. For example, when people have more money, they tend to buy more things, and the resulting demand pushes up prices
What are interest rates?
An interest rate represents the cost of borrowing money. It also offers compensation to those who provide the service, and take the risk, of lending money. Interest rates keep an economy moving by encouraging people to borrow, to lend and to spend. But interest rates are always changing, and different loans offer different rates. If you are a lender, a borrower or both, it’s important you understand the reasons for these changes and differences.
The Bank of Canada will raise its policy interest rate (i.e., the overnight rate) if it intends to slow inflation. When the Bank raises its overnight rate, people and businesses pay higher interest for loans and mortgages. This discourages them from borrowing, reduces overall spending and, typically, reduces inflation.
How should I manage my investments amid volatility?
Keep cool and maintain perspective
Market swings can rattle the nerves of even long-time investors. But volatility is part of investing.
“Dramatic moves in the market may cause you to question your strategy and worry about your money,” says Ann Dowd, CFP, Vice President at Fidelity Investments. “A natural reaction to that fear might be to reduce or eliminate any exposure to stocks, thinking it will stem further losses and calm your fears, but that may not make sense in the long run.”
Market downturns may be nerve-rattling and unpleasant, but historically stocks tend to recover from declines and provide investors with positive long-term returns. Canadian stocks eventually recovered after dropping significantly during the global financial crises that occurred over 2008 and 2009. South of the border, U.S. equity markets saw sharp drops in the second half of 2015 when China devalued its currency, and then again in early 2016 in response to a period of falling oil prices. Later in 2016, after the Brexit vote, U.S. stocks fell again, as they did in the run-up to the 2016 U.S. presidential election that Donald Trump ultimately won. And again in 2018, concerns about trade between the U.S. and China rattled investors, and U.S. stocks fell. Still, during this three-year period, the market was up more than 30% overall.
Timing the market
There is an axiom that investors should focus on “time in the market over timing the market.” This means that rather than trying to guess when the market will move up and down, you invest at regular intervals (more on this later) and assume that over the long term, the stock market will rise. Studies show the decisions investors make about when to buy and sell cause their investments to perform worse than had they simply bought and held the same funds.
Take advantage of opportunities
There are things you can do on your own, or with your advisor, while markets are in a trough to put you in a better position for the long term. For example, if you have investments you are looking to sell, a downturn may provide the opportunity for tax-loss harvesting, that is, selling an investment and taking a loss. Depending on what tax jurisdiction you are in, this could result in paying lower taxes in the short term. You may also want to review the asset mix in your portfolio. You may be able to take advantage of lower prices for some assets and rebalance your investments.
Invest regularly
If you invest regularly over months, years and decades, short-term downturns should not have much of an impact on your overall performance. Instead of trying to judge when to buy and sell based on market conditions at any given moment, you can take a more disciplined approach. This means making investments weekly, monthly or quarterly, no matter what the stock market is doing. An advisor can help you with this too. This helps you avoid the perils of market timing.
Of course, even if you keep investing through downturns, it won’t guarantee gains, or that you will never experience a loss. But when prices do fall, you may actually benefit. When the market drops, the prices of investments fall, and your regular contributions allow you to buy a larger number of shares with the same amount of money.
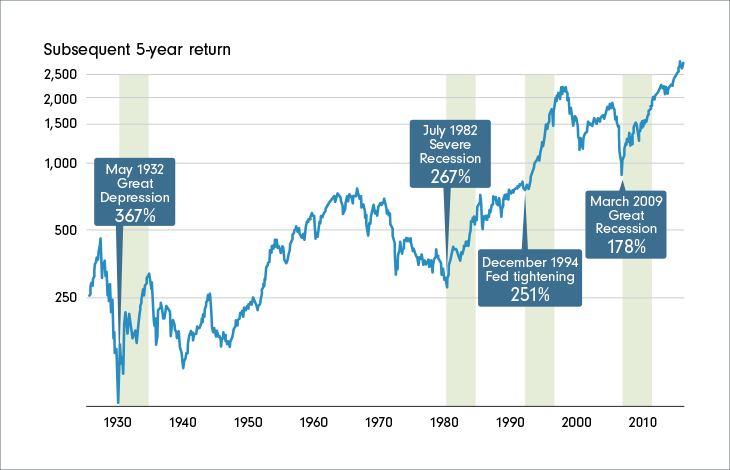
In fact, what have historically seemed like some of the worst times to get into the market turned out to be the best. The best five-year return in the U.S. stock market began in May 1932, which also happened to be in the middle of the Great Depression. The next best five-year period began in July 1982, when the U.S. economy was suffering through one of the worst recessions in the postwar period. Both the U.S. and Canada saw double-digit levels of unemployment and interest rates.
Avoid behaviours that may hinder success
Addressing behavioural challenges
Understanding behavioural finance helps avoid emotion-driven decisions that can lead to unnecessary losses. There are six major investor behaviours that help explain why investors make the decisions they do.
Anchoring bias
Anchoring bias occurs when people rely too much on the first information they find when making decisions. For example, if you first see a T-shirt that costs $1,200, and then see a second one that costs $100, you’re prone to see the second shirt as cheap. But if you’d only seen the second shirt, priced at $100, you’d probably not consider it cheap. The first price you saw (i.e., the anchor) influenced your opinion. This type of bias is most commonly seen in retail shopping, but can also affect how you value individual assets such as stocks. It’s best to acknowledge the anchor when making decisions, but ultimately remember the goal, not the dollars.
Confirmation bias
This phenomenon occurs when investors seek out information that confirms an existing belief, and filter out potentially useful facts and opinions that don’t align with theirs. This can be described as a natural tendency to search for answers that you want to hear rather than the answers that are correct. Seeking out confirmation of options can lead to “group think,” but keep in mind different situations call for different expertise.
Herding bias
Going along with the crowd may prevent you from being alone in your embarrassment, but it won’t keep you from being wrong. Herding bias is also known as the “bandwagon effect,” a psychological phenomenon rooted in early human behaviour in which people rationalize a course of action as being right because everybody else is doing it. This can take the form of panic buying or selling: “Everyone else is doing it, so I should too.”
Recency bias
Recency bias occurs when people make decisions based on recent events or the most recent information. This can cause people to make emotional decisions based on recent or short-term outcomes, neglecting the rational aspects of the situation and what happened in the past. This bias can have a big effect on investors. If you find yourself experiencing recency bias, remind yourself that yesterday’s truth is not tomorrow’s.
Ambiguity aversion
This concept is often expressed by the proverb, “Better the devil you know.” Ambiguity aversion is the tendency to avoid the unknown by having a preference for known risks over unknown risks. An ambiguity-averse person tends to make choices where the outcomes are known over one where the probabilities are unknown.
The Daniel Ellsberg paradox is an experiment in which people are asked to select a ball from one of two bags and guess its colour. One bag contains 50 red balls and 50 black balls and the other contains 100 red and black balls in an unknown ratio. The results show more people choose the first bag, where there is more certainty in the outcome (that is, a 50% chance of guessing correctly). Fewer people choose the second bag, where there is more ambiguity in the outcome. The key to preventing ambiguity aversion is goal-based planning in which outcomes drive your actions, not fear of the unknown.
Myopic loss aversion
Myopic loss aversion is the combination of a greater sensitivity to losses than to gains and a tendency to evaluate outcomes frequently. This is why people tend to report that losing $100 hurts twice as much as the positive feeling they experience by gaining $100. You could lock in losses by panic selling during a market downturn, but focusing on long-term goals can help you avoid this behaviour.
Four strategies to help investors break the behaviours
1. Get to know yourself
Become aware of how your tendencies can influence your investment decisions. It can be difficult to develop such self-awareness, but reviewing your investment choices in past periods of volatility can offer a clue as to the type of investor you are.
2. Avoid panic selling
Stay invested during market downturns and periods of volatility, with the knowledge that markets tend to trend upward over the long term.
3. Stay focused
While it’s fine to review previous investment decisions to gain insight into your own behaviour, you should avoid dwelling on past results. Focus on your long-term investment goals and your long-term investment horizon. For example, if you aim to retire by the age of 62, think about what your investments will be worth then, assuming markets rise over a long period.
4. Talk to your advisor regularly
Your financial advisor can help you think about your investments in a different way, taking the emotion (both negative and positive) out of investing.
Step away from the noise
During uncertain times, what can investors do to ease feelings of stress, worry and panic? Well, there are several things. You could go for a walk, spend time with your family and friends or even binge-watch a good show. You can also learn to focus on what is under your control and remember to keep long-term investment objectives in mind. Sometimes it’s best to leave the so-called “dirty work” of monitoring financial markets and thinking about how best to balance your portfolio to your financial advisor.
Market history
Subsequent five-year returns of worst U.S. stock market downturns
As you can see in the graphic below, U.S. stocks have enjoyed strong returns following some of the worst downturns in the past century. Going as far back as the Great Depression in 1932, stocks enjoyed a subsequent five-year return of 367%. That means if you’d invested $100 at the depths of the market downturn, it would be worth $367 five years later.*
Volatility toolkit
Fidelity has four interactive tools you can use to help you understand how markets have crashed and then recovered throughout history. For example, you can see how long it took Canadian stocks to recover from five of the biggest stock market crashes in the past century. It took Canadian equities only 47 days to recover their value after the terrorist attacks in New York on September 11, 2001. But it took over two years for Canadian stocks to recover following the subprime mortgage crisis in 2008 and 2009.