



The strength of asset allocation
Authors:
Hannah Commoss Institutional Portfolio Manager, Fidelity Investments
Mia Kafoury Institutional Portfolio Manager, Fidelity Investments
When it comes to building model portfolios, there are benefits to taking a strategic view.
A feature article from our U.S. partners

- Strategic approaches to asset allocation apply modern portfolio theory and long-term return projections to determine allocations within a portfolio, seeking to allocate assets along the efficient frontier.
- Greater diversification can lead to higher risk-adjusted returns, as shown by movement along the efficient frontier.
- Disciplined and regular rebalancing can help improve risk-adjusted returns over time by reducing volatility and mitigating the impact of market drawdowns.
- We believe that building portfolios using a strategic asset allocation framework, that also incorporates rebalancing, is an effective way to balance risk and return for a wide range of investors.
Increasing volatility, rising asset class correlations, higher interest rates, and the emergence of alternative investments: There’s no question that the investing landscape of the 2020s presents a different set of challenges than that of previous decades. When it comes to building model portfolios that can meet those challenges, a strategic asset allocation still delivers on its objective of providing attractive risk-adjusted returns over long-term horizons. We believe that defining a strategic asset allocation is the most important decision an investor makes, accounting for a majority of the variation of portfolio returns.
Strategic asset allocation
Asset allocation is an investment strategy that seeks to combine various asset classes such as domestic and foreign stocks, bonds, and cash with the goal of matching portfolio-level risk (longer-term return variability) with the stated risk tolerance of a given investor.
The goal of strategic asset allocation is to arrange asset classes so that the resulting portfolio volatility is lower than the sum of its individual components. Because different asset classes tend to react differently to changing market and economic conditions, a well-designed allocation can help to manage risk without impairing expected return.
Strategic asset allocation seeks to maximize the benefits of diversification by arranging asset classes as efficiently as possible, often through the use
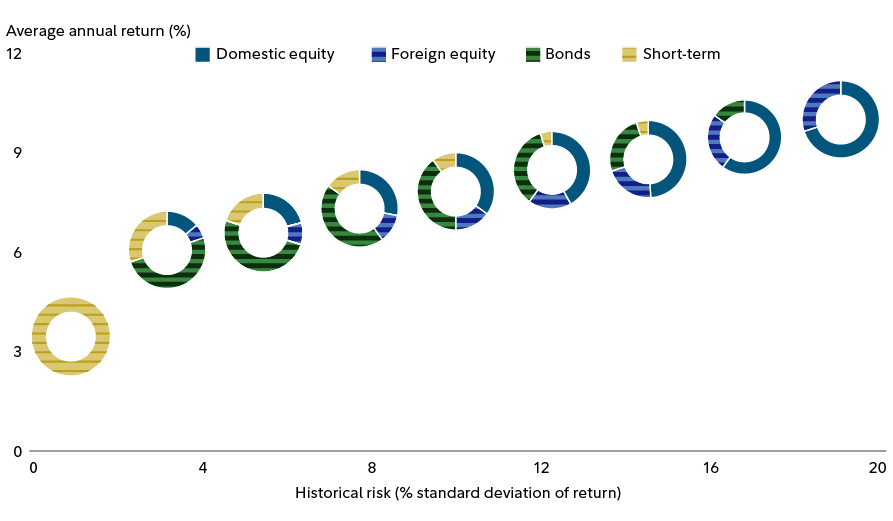
of mean variance-based optimization.1 Within this context, efficiency is defined as the highest possible return for a given level of risk. Positioned along the risk spectrum, each allocation mix defines what has come to be known as the efficient frontier (Exhibit 1).
Over time, many portfolio managers have added additional asset classes, such as emerging-market equities, emerging-market bonds, commodities, currencies, real estate investment trusts, and alternative investments to augment the allocation mix and drive efficiency measures higher. The intent of this evolution has been to move the efficient frontier upward, increasing the amount of potential return at any given point along the risk spectrum. Regardless of the mix of assets, strategic asset allocation starts with risk. It is the first thing that most optimization processes solve for. Due to the relationship between risk and return for each asset class, an expected level of return for the entire portfolio can be estimated based on its risk characteristics. This consideration of risk has important implications for the management of a strategically allocated portfolio.
Exhibit 1: Allocation mixes aligned along the efficient frontier
|
Short- term |
Conservative |
Moderate with income |
Moderate |
Balanced |
Growth with income |
Growth |
Aggressive growth |
Most aggressive |
Average returns |
3.29% |
5.82% |
6.59% |
7.26% |
7.89% |
8.49% |
8.97% |
9.71% |
10.29% |
Historical volatility |
0.86% |
4.55% |
6.19% |
7.83% |
9.54%
|
11.27% |
12.97% |
15.62% |
18.25% |
Rebalancing: A key tenet of strategic asset allocation
If portfolio risk is ultimately a function of a specific mix of assets, then it follows that any deviation from this mix could result in unanticipated changes to the risk profile of the portfolio. Since asset class valuations are in a near-constant state of flux, portfolio risk is seldom static.
Rebalancing is the tool by which asset allocators can keep portfolio risk aligned with an investor’s risk tolerance across different market environments. Methodologies can vary. Calendar-based rebalancing may use monthly, quarterly, semiannual, or any number of time-based periods to realign portfolio weights with target allocations. Other managers may use bandwidth constraints that attempt to keep asset class weights within a specified range. Either way, the goal is to keep portfolio allocations aligned with their target weights.
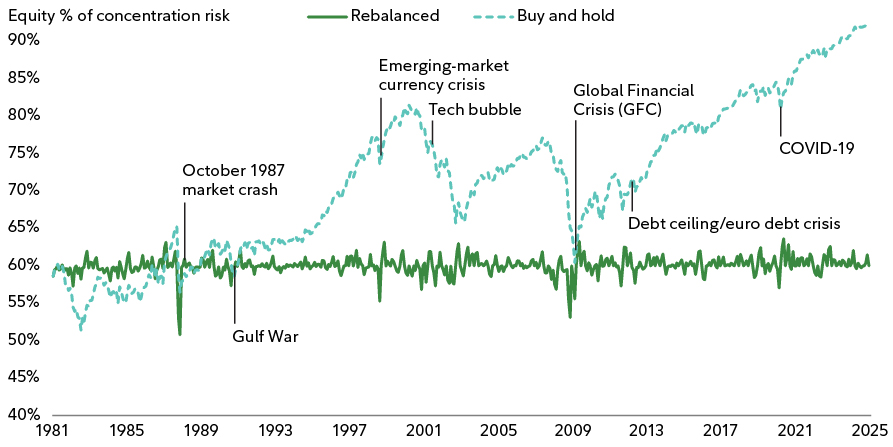
Beyond its purely mechanical aspects, rebalancing can also introduce additional positive attributes to the portfolio. Often termed “rebalancing gains,” the process of disciplined and regular rebalancing introduces a dollar-cost-averaging effect into a portfolio. As markets move, rebalancing involves selling off assets that have moved up in value and adding to assets that have lagged or declined. This can reduce the average cost of each asset exposed to the rebalancing process. A related benefit can be found in the avoidance of excess concentration in a particular asset class after a major run-up in prices. This prevents the portfolio from being overly exposed to at-risk asset classes at market inflection points (Exhibit 2).
Exhibit 2: Rebalancing a portfolio composed of 60% stocks and 40% bonds back to its target mix on a quarterly basis over the past few decades would have avoided concentration in highly valued assets at market peaks.
How rebalancing affects concentration risk
Measuring risk
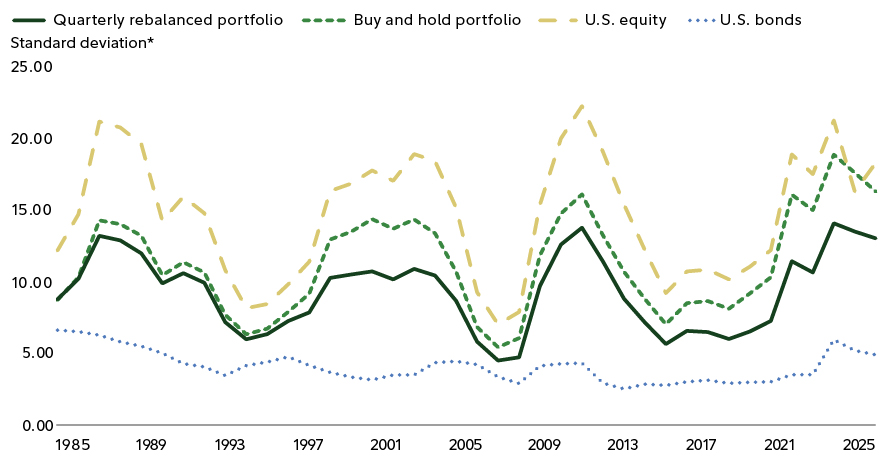
Since risk is central to the concept of strategic asset allocation, it makes sense to look at more than return alone. Here the evidence is unambiguous. In our analysis, rebalanced portfolios exhibited consistently less risk than buy-and-hold portfolios (Exhibit 3).
Long time periods can cover a multitude of sins, so we looked at rolling three-year periods and what we see is that the annualized standard deviation of monthly returns for the rebalanced portfolio was significantly below that of the buy-and-hold portfolio. The average reduction in volatility over the period was 2.1%.
Exhibit 3: Rebalancing a portfolio made up of 60% stocks and 40% bonds over a recent 40-year period resulted in consistently lower volatility than a portfolio that wasn’t rebalanced back to its target asset mix.
The impact of rebalancing on risk
Building resilient portfolios
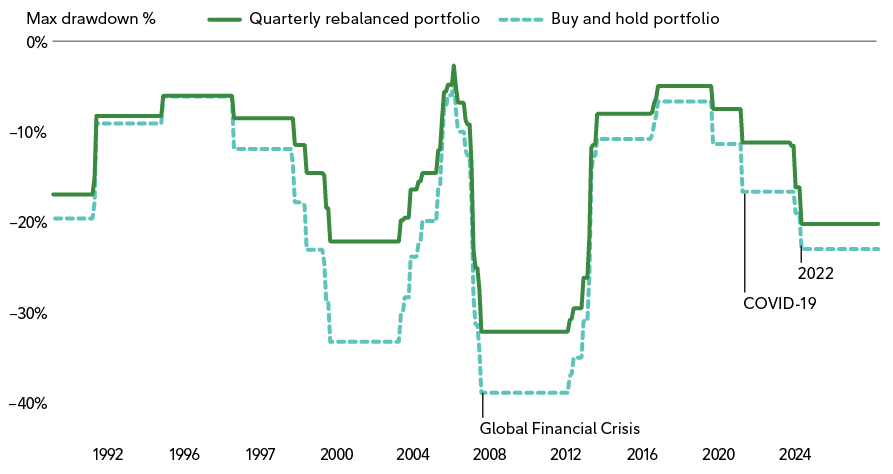
Another key component of strategic allocation is building resilient portfolios that can weather severe market drawdowns. One way to evaluate portfolio resilience return is to look at metrics such as maximum drawdown. Utilizing rolling 5-year max drawdowns, Exhibit 4 shows that the rebalanced portfolio suffered less severe drawdowns throughout the 40-year time horizon, outperforming the buy-and-hold portfolio by 6.8% through the sustained bear market following the dot-com crash of the early 2000s, by 6.1% during the Global Financial Crisis, and by 2.8% during the COVID crash of 2020.
Exhibit 4: Impact of strategic allocation on drawdown severity
Rolling five-year max drawdown, 1986–2025
Conclusion
Our analysis shows that strategic asset allocation is an effective asset allocation approach because it places the management of risk at the heart of this process. We believe identifying an investor’s risk tolerance and constructing a portfolio that attempts to meet that risk tolerance is in an investor’s best interest and offers the best road map for achieving one’s long-term investment goals.
Footnotes
Date first published: April 10, 2026
Endnote
1. Mean-variance optimization is an analysis conducted as part of the portfolio construction process, which determines an allocation that will maximize the expected return of the asset mix after accounting for the risk tolerance of the investor, for the expected variance of the asset mix. Mean-variance optimization is an important tenant of modern portfolio theory.
Index definitions
The Russell 1000 Index is a market capitalization-weighted index designed to measure the performance of the large cap segment of the U.S. equity market.
S&P 500® is a market capitalization-weighted stock market index tracking the performance of 500 of the largest publicly traded U.S. companies.
Bloomberg U.S. Aggregate Bond Total Return USD is a broad flagship benchmark that measures the total return performance of the U.S. investment-grade, U.S. dollar-denominated, fixed-rate taxable bond market.
MSCI EAFE is an equity index that captures large and mid cap representation across developed-market countries around the world, excluding the U.S. and Canada. The index covers approximately 85% of the free float-adjusted market capitalization in each country.
MSCI ACWI ex USA captures large and mid cap representation across developed-market (DM) countries (excluding the U.S.) and emerging-market (EM) countries. The index covers approximately 85% of the global equity opportunity set outside the U.S.
Unless otherwise expressly disclosed to you in writing, the information provided in this material is for educational purposes only. Any viewpoints expressed by Fidelity are not intended to be used as a primary basis for your investment decisions and are based on facts and circumstances at the point in time they are made and are not particular to you. Accordingly, nothing in this material constitutes impartial investment advice or advice in a fiduciary capacity, as defined or under the Employee Retirement Income Security Act of 1974 or the Internal Revenue Code of 1986, both as amended. Fidelity and its representatives may have a conflict of interest in the products or services mentioned in this material because they have a financial interest in the products or services and may receive compensation, directly or indirectly, in connection with the management, distribution, and/or servicing of these products or services, including Fidelity funds, certain third-party funds and products, and certain investment services. Before making any investment decisions, you should take into account all of the particular facts and circumstances of your or your client’s individual situation and reach out to an investment professional, if applicable.
Information presented herein is for discussion and illustrative purposes only and is not a recommendation or an offer or solicitation to buy or sell any securities. Views expressed are as of 3/16/26, based on the information available at that time, and may change based on market and other conditions. Unless otherwise noted, the opinions provided are those of the authors and not necessarily those of Fidelity Investments or its affiliates. Fidelity does not assume any duty to update any of the information.
Unless otherwise expressly disclosed to you in writing, the information provided in this material is for educational purposes only. Any viewpoints expressed by Fidelity are not intended to be used as a primary basis for your investment decisions and are based on facts and circumstances at the point in time they are made and are not particular to you. Accordingly, nothing in this material constitutes impartial investment advice or advice in a fiduciary capacity, as defined or under the Employee Retirement
Income Security Act of 1974 or the Internal Revenue Code of 1986, both as amended. Fidelity and its representatives may have a conflict of interest in the products or services mentioned in this material because they have a financial interest in the products or services and may receive compensation, directly or indirectly, in connection with the management, distribution, and/or servicing of these products or services, including Fidelity funds, certain third-party funds and products, and certain investment services. Before making any investment decisions, you should take into account all of the particular facts and circumstances of your or your client’s
individual situation and reach out to an investment professional, if applicable.
Investment decisions should be based on an individual’s own goals, time horizon, and tolerance for risk. Nothing in this content should be considered legal or tax advice, and you are encouraged to consult your own lawyer, accountant, or other advisor before making any financial decision.
Stock markets are volatile and can fluctuate significantly in response to company, industry, political, regulatory, market, or economic developments.
In general, the bond market is volatile, and fixed income securities carry interest rate risk. (As interest rates rise, bond prices usually fall, and vice versa. This effect is usually more pronounced for longer-term securities.)
Fixed income securities carry inflation, credit, and default risks for both issuers and counterparties.
Investing involves risk, including risk of loss.
Past performance is no guarantee of future results.
Diversification and asset allocation do not ensure a profit or guarantee against loss.
All indexes are unmanaged. You cannot invest directly in an index.
S&P 500® is a market capitalization-weighted index of 500 common stocks chosen for market size, liquidity, and industry group representation to represent U.S. equity performance. S&P 500 is a registered service mark of The McGraw-Hill Companies, Inc., and has been licensed for use by Fidelity Distributors Corporation and its affiliates.
Bloomberg U.S. Aggregate Bond is a broad-based, market value-weighted benchmark that measures the performance of the investment-grade, U.S. dollar-denominated, fixed-rate taxable bond market.
MSCI Emerging Markets (EM) Index is a market capitalization-weighted index designed to measure the investable equity market performance for global investors in emerging markets.
CBOE Volatility Index is a weighted average of prices on S&P 500 Index options with a constant maturity of 30 days to expiration. It is designed to measure the market’s expectation of near-term stock market volatility.
The Bloomberg U.S. Government/Credit 1–5 Year Index tracks the performance of investment-grade, U.S. dollar-denominated, fixed-rate Treasuries, government-related (agency, sovereign, supranational, and local authority), and corporate securities with remaining maturities between 1 and 5 years.
Third-party marks are the property of their respective owners; all other marks are the property of FMR LLC.
The Chartered Financial Analyst® (CFA®) designation is offered by CFA Institute. To obtain the CFA charter, candidates must pass three exams demonstrating their competence, integrity, and extensive knowledge in accounting, ethical and professional standards, economics, portfolio management, and security analysis, and must also have at least 4,000 hours of qualifying work experience completed in a minimum of 36 months, among other requirements. CFA® is a trademark owned by CFA Institute.
In the U.S., Fidelity Investments® provides investment products through Fidelity Distributors Company LLC; clearing, custody, or other brokerage services through National Financial Services LLC or Fidelity Brokerage Services LLC (Members NYSE, SIPC); and institutional advisory services through Fidelity Institutional Wealth Adviser LLC.
Personal and workplace investment products are provided by Fidelity Brokerage Services LLC, Member NYSE, SIPC.
Institutional asset management is provided by FIAM LLC and Fidelity Institutional Asset Management Trust Company.
© 2026 FMR LLC. All rights reserved.
1254371.1.0 1.9922610.100
This is original content from Fidelity Investments in the U.S. No recipient is authorized to pass this communication on to any other person whatsoever or reproduce it by any means without the prior written consent of Fidelity.
This document is used by Fidelity Investments Canada ULC (“FIC”) and is not meant to endorse or sponsor any specific Fidelity product or service. FIC investment funds are advised by our investment division, Fidelity Canada Investment Management, or sub-advised by a variety of companies, such as Fidelity Management & Research Company LLC, FIAM LLC, FIL Limited, Geode Capital Management LLC and State Street Global Advisors Ltd. Mutual funds, ETFs and other investment products and services that are sponsored by FIC are only qualified for sale in the provinces and territories of Canada.
Portions © 2026. FMR LLC. All rights reserved. Used with permission.
US Compliance ID: 1254371.1.0
Can Compliance ID:
From time to time a manager, analyst or other Fidelity employee may express views regarding a particular company, security, and industry or market sector. The views expressed by any such person are the views of only that individual as of the time expressed and do not necessarily represent the views of Fidelity or any other person in the Fidelity organization. Any such views are subject to change at any time, based upon markets and other conditions, and Fidelity disclaims any responsibility to update such views. These views may not be relied on as investment advice and, because investment decisions for a Fidelity Fund are based on numerous factors, may not be relied on as an indication of trading intent on behalf of any Fidelity Fund.
Certain Statements in this commentary may contain forward-looking statements (“FLS”) that are predictive in nature and may include words such as “expects”, “anticipates”, “intends”, “plans”, “believes”, “estimates” and similar forward-looking expressions or negative versions thereof. FLS are based on current expectations and projections about future general economic, political and relevant market factors, such as interest and assuming no changes to applicable tax or other laws or government regulation. Expectations and projections about future events are inherently subject to, among other things, risks and uncertainties, some of which may be unforeseeable and, accordingly, may prove to be incorrect at a future date. FLS are not guarantees of future performance, and actual events could differ materially from those expressed or implied in any FLS. A number of important factors can contribute to these digressions, including, but not limited to, general economic, political and market factors in North America and internationally, interest and foreign exchange rates, global equity and capital markets, business competition and catastrophic events. You should avoid placing any undue reliance on FLS. Further, there is no specific intentional of updating any FLS whether as a result of new information, future events or otherwise.
Commissions, fees and expenses may be associated with investment funds. Read a fund’s prospectus or offering memorandum and speak to an advisor before investing. Funds are not guaranteed, their values change frequently and investors may experience a gain or loss. Past performance may not be repeated.
Read our privacy policy. By using or logging in to this website, you consent to the use of cookies as described in our privacy policy.
This site is for persons in Canada only. Mutual funds and ETFs sponsored by Fidelity Investments Canada ULC are only qualified for sale in the provinces and territories of Canada.
Information presented herein is for discussion and illustrative purposes only and is not a recommendation or an offer or solicitation to buy or sell any securities. Views expressed are as of the date indicated, based on the information available at that time, and may change based on market and other conditions. Unless otherwise noted, the opinions provided are those of the authors and not necessarily those of Fidelity Investments or its affiliates. Fidelity does not assume any duty to update any of the information.
Diversification does not ensure a profit or guarantee against a loss.
Third-party trademarks and service marks are the property of their respective owners. All other trademarks and service marks are the property of
FMR LLC or an affiliated company.
Fidelity Model Portfolios are made available to intermediaries on a non-discretionary basis by Fidelity Institutional Wealth Adviser LLC (FIWA)®, a registered investment adviser, or by Fidelity Distributors Company LLC, a registered broker-dealer. Investment performance of the Fidelity Model Portfolios depends on the performance of the underlying investment options and on the proportion of the assets invested in each underlying investment option over time. The performance of the underlying investment options depends, in turn, on their investments, which will vary day
to day in response to many factors. Asset allocation strategies are subject to the volatility of the financial markets, including that of the underlying
investment options’ asset class.
Investing risks
Stock markets are volatile and can fluctuate significantly in response to company, industry, political, regulatory, market, or economic developments. Foreign markets can be more volatile than U.S. markets due to increased risks of adverse issuer, political, market, or economic developments, all of which are magnified in emerging markets. These risks are particularly significant for investments that focus on a single country or region.
Investing involves risk, including risk of loss. Alternative investment strategies may not be suitable for all investors and are not intended to be a complete investment program. Alternatives may be relatively illiquid; it may be difficult to determine the current market value of the asset; and there may be limited historical risk and return data. Costs of purchase and sale may be relatively high. A high degree of investment analysis may be required before investing.
Personal and workplace investment products are provided by Fidelity Brokerage Services LLC, Member NYSE, SIPC. Institutional asset management is provided by FIAM LLC and Fidelity Investments Asset Management Trust Company.
Fidelity Investments provides investment products through Fidelity Distributors Company LLC; clearing, custody, or other brokerage services through National Financial Services LLC or Fidelity Brokerage Services LLC, Members NYSE, SIPC; and institutional advisory services through Fidelity Institutional Wealth Adviser LLCSM.
Fidelity Institutional Wealth Adviser LLC (“FIWA”)® is a registered investment adviser and an indirect, wholly owned subsidiary of FMR LLC. FIWA is the sponsor of the Fidelity Managed Account Xchange® program (“FMAX” or the “Platform”). FMAX is a comprehensive wealth management platform consisting of advisory tools, programs and services, and investment products from Fidelity and other leading asset managers. Some services are provided by affiliated and unaffiliated third parties. FMAX offers robust Fidelity service and support and a simplified client experience. FMAX provides investment advisory and platform services for a fee. FMAX is offered by FIWA, an affiliate of Fidelity Brokerage Services LLC, Members NYSE, SIPC; and National Financial Services LLC. The FMAX Platform is not a brokerage product.
© 2026 FMR LLC. All rights reserved.