Three charts on the benefits of staying invested

These three charts may help you understand market volatility and what you should know as an investor. Remember that markets have seen downturns before, and history shows that dips are followed by recoveries.
Time reduces the volatility of returns
This chart shows a comparison of the highest and lowest returns for various investment time frames from December 1981 to December 2024. For example, the results for the one-year investment time frame are based on 505 sample one-year periods: December 1981 to December 1982, December 1982 to December 1983, and so on, up to December 2023 to December 2024.
As you can see, if you stay invested over time, volatility can be reduced, even across different investments.

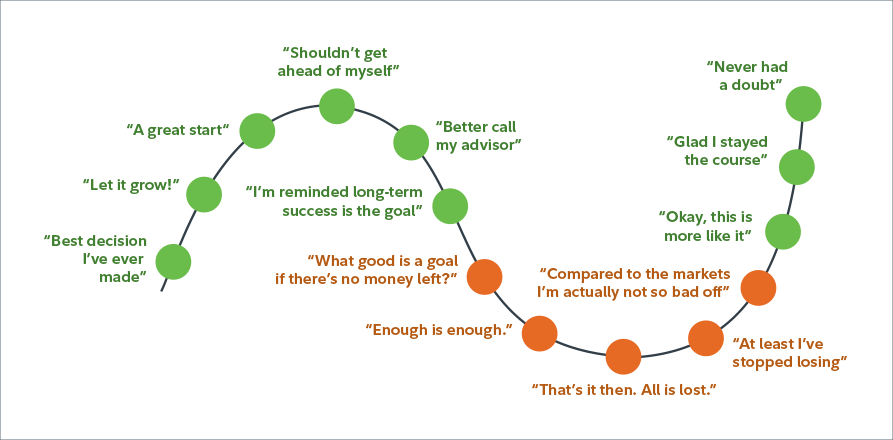
The cycle to success
Market volatility can cause lots of panic. Markets have been, are and always will be cyclical. Historically, markets that have gone down eventually recovered.
This chart is a simple way to look at how many investors feel during an economic downturn. When markets start to recover, those who stayed invested tend to feel relieved, because they may benefit from the market recovery.
Don’t miss out on the market’s best days
Since we cannot time the market, it can be tempting to pull out your money from fear of potentially losing it all. What you don’t realize is that you put your portfolio at the potential risk of missing out on the market’s best day.
The chart below shows that a $10,000 investment can gain approximately $18,084 by missing out on 60 of a market’s best days, which is significantly lower than if fully invested.

What to do next?
Since you can’t time the market, the best thing to do is to reach out to your financial advisor and talk about what is right for your portfolio.

