Planning for retirement income: Five key retirement factors
Planning for retirement starts with thinking about your retirement goals and how long you have to meet them. Here are five key factors you should consider:
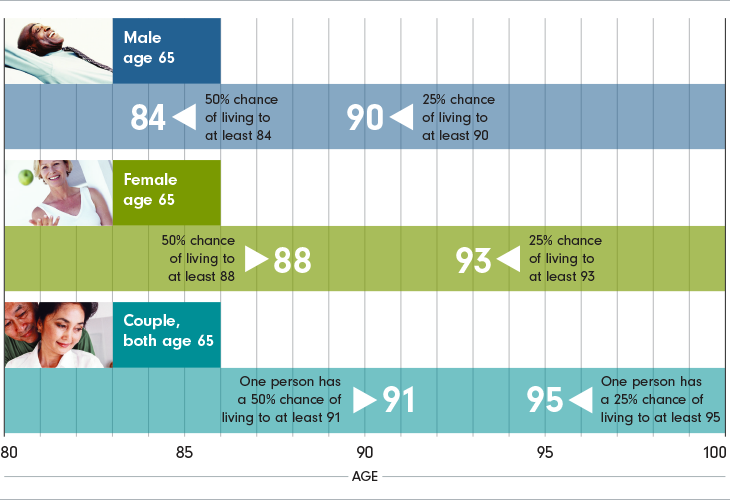
#1. Longevity
Retirees need to plan for possible longer life expectancies: you could spend as much time in retirement as you did at work. You need to plan for this so you don’t outlive your savings.
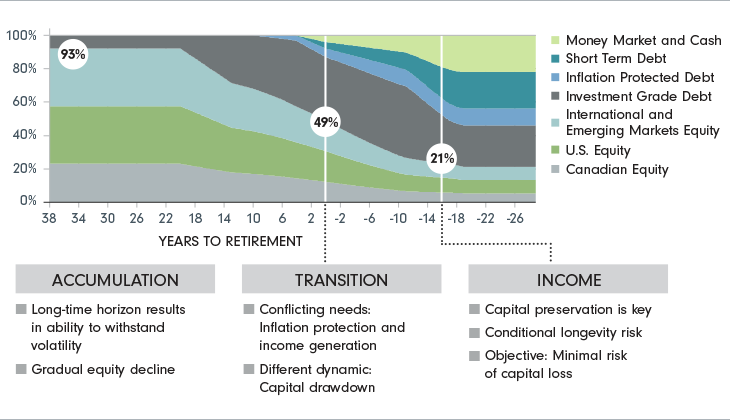
#2. Asset allocation
With today’s longer retirements, investing too conservatively too early may be risky as savings may not grow enough. The chart below illustrates three phases of asset allocation in portfolios as retirement approaches: accumulation, transition and income. Graphs and charts are used for illustrative purposes only. Particular investment strategies should be evaluated according to an investor’s investment objectives and tolerance for risk.
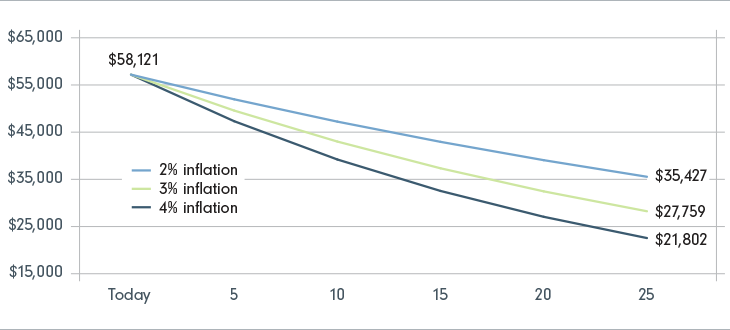
#3. Inflation
Inflation reduces the purchasing power of your retirement savings. For example, an item purchased in 1993 for $100 would cost $183.57 in 2023.1
Source: Fidelity Investments Canada ULC.
1Source: Bank of Canada Inflation Calculator
#4. Withdrawal rate
If you withdraw funds too quickly and too early from your retirement savings plan, you could put yourself in danger of running out of money.
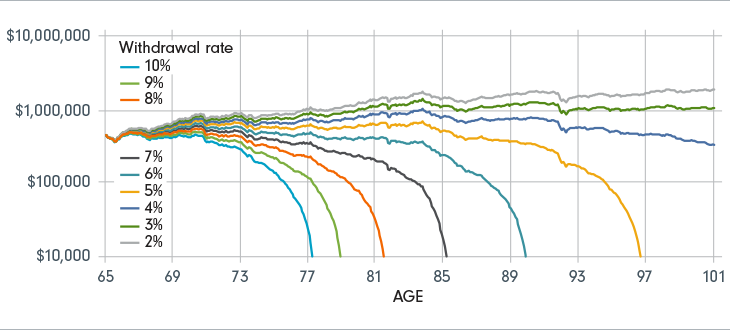
Source: Fidelity Investment Canada ULC and Data stream. Hypothetical value of assets held in an untaxed account of $500,000 invested in a portfolio of 50% stocks (25% in S&P/TSX, 12.5% in S&P 500, 12.5% in EAFE), 40% bonds, and 10% short-term investments with inflation-adjusted withdrawal rates as specified. This chart’s hypothetical illustration uses historical monthly performance from March 1965 though February 1995. Stocks, bonds and short-term investments are represented by S&P/TSX Composite (Canadian Equity Index), S&P 500 (U.S. Equity Index), MSCI EAFE (Developed World Equity Index ex N.A.), FTSE Canada Universe Bond Index and FTSE Canada 91-day T-Bills. Performance is shown in US dollars. This chart is for illustrative purposes only and is not indicative of any investment advice. Past performance is no guarantee of future results.
#5. Health care
Are you worried about health care costs depleting your retirement savings? Rising health care costs are a risk to retirement savings.
