Should I invest in equities?

Greater risk can mean greater return, you might have heard this saying. Still, many investors shy away from equity investments, which can be found in actively managed mutual funds, fearing the stock market’s potential volatility.
It’s true that over the short term, equity returns can fluctuate substantially, but historically, mutual funds tend to become less volatile the longer you hold on to them, while continuing to provide the potential for growth. On the other hand, fixed income investments, such as guaranteed investment certificates (GICs) and bonds, may generate consistent returns, but their growth tends to be limited.
While it’s important to be aware of risk, being too conservative can also be risky. These “safe” investments alone may not generate the growth you desire to build retirement savings – especially when inflation is factored in. Most GICs also have a lock-in period, meaning you pay a penalty for pulling out money before the maturity date, which can be three months to five years.
Diversification is the best solution to find a balance between risk and returns. Actively managed funds can invest in both equities and fixed income.
Here’s how actively managed funds compare to GICs:
| Actively managed funds | Characteristics | GICs |
|---|---|---|
| Higher | Rates of return | Lower |
| Higher | Level or risk | Lower |
| Higher | Fees | Lower |
| Higher | Ability to diversify investment | Lower |
| Lower | Locked-in time period | Higher |
Learn more about diversification and your portfolio
What are the benefits of investing in equities?
Putting at least some of your money in equities may give you a better chance of reaching your savings goals. And the longer time frame you have to invest for, the less of a concern volatility should be.
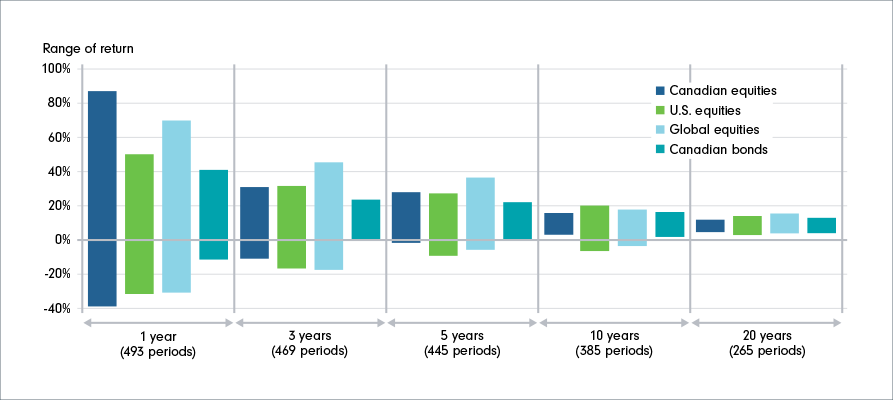
Let’s look at a comparison of investments over the past 40 years. Starting with investments made over a one-year period, the chart below shows lots of volatility across asset classes, and that equities are more volatile in the short term. Then, if we look at investments over 20-year periods, the chart shows that equities start to line up with bonds and become less volatile.
Time can reduce the volatility seen in equities
Here is a comparison of the highest and lowest returns for various investment time frames from December 1981 to December 2024, shown in the chart below. For example, the results for the one-year investment timeframe are based on 505 samples of one-year periods: Dec. ‘81 to Dec. ‘82, all the way to Dec. ’23 to Dec. ’24.
Test out the volatility of your portfolio with these tools
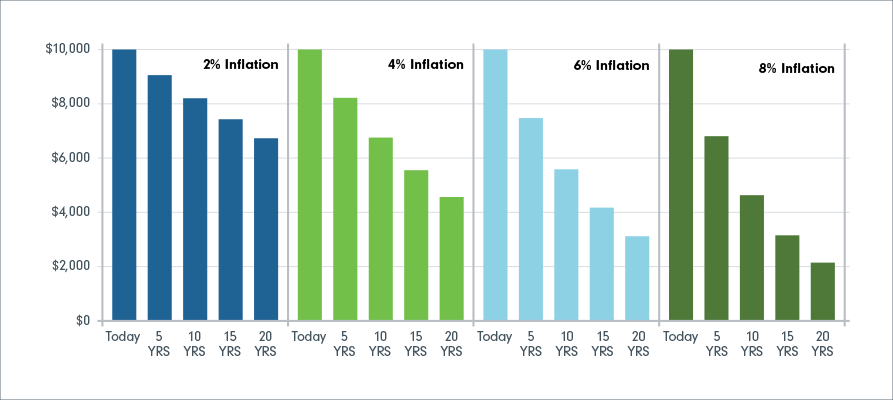
Factoring inflation into your returns
When calculating your investment goals, it is important to factor in inflation. In Canada, if the annual inflation rate is around 2%1, meaning the relative value of $1,000 today drops to about $980 next year. Although you may still have $1,000 in your savings account next year, the price of goods and cost of living may have risen in that time frame. This means next year, your $1,000 will be able to buy the same amount as if you had $980 today.
As you can see, there are risks to relying on low inflation for your investments: the future holds no guarantees – and even low inflation rates can eat away at your savings. With the sharp and sudden increase in the rate of inflation over the past year, it has eroded signigicant value from savings in what many believe are “safe” investments.
The risk of inflation is one reason so-called “safe” investments such as GICs may not be so safe after all. Often they have low returns, so on their own they may not generate enough to meet your goals once the increased cost of living is factored in. Consider diversifying your portfolio with equities for better growth potential to offset the impact of inflation.
Now let’s look at what happens to your purchasing power over a longer time frame due to inflation. The chart below shows the effect of inflation on $10,000. Even at the relatively low inflation rate of 2%, $10,000 shrinks to $6,729 of purchasing power in 20 years.