
Iran conflict: Is investor reaction proportionate to potential outcomes?
A feature article from our U.S. partners
Market pricing points to containment, although escalation risks could challenge growth and inflation assumptions.
- Despite heightened geopolitical risk, cross-asset signals, including U.S. Treasury yields and the 10-year breakeven inflation rate, suggest investors view the conflict with Iran as short-lived and manageable.
- If hostilities were to escalate or constrain energy supply for a prolonged period, the market narrative could shift toward slower growth and higher inflation—known as stagflation.
- A return to 1970s-era stagflation is unlikely because energy markets and the economy are more geographically diverse, the U.S. can tap strategic reserves, and policymakers have better tools to respond.
- Still, client portfolios that are over-allocated to long-duration growth equities, long-duration bonds, or idle cash, may need better inflation resilience.
Watching for signs of market stress
The widening conflict involving the U.S., Israel, and Iran represents a meaningful geopolitical risk, particularly given the Strait of Hormuz’s role as a critical energy chokepoint. Despite these developments, global financial markets have reacted with surprisingly limited stress thus far. This divergence between geopolitical risk and market behavior reflects a clear message from investors: Markets are currently pricing this conflict as a short-lived or contained event, rather than a prolonged disruption with lasting economic consequences.
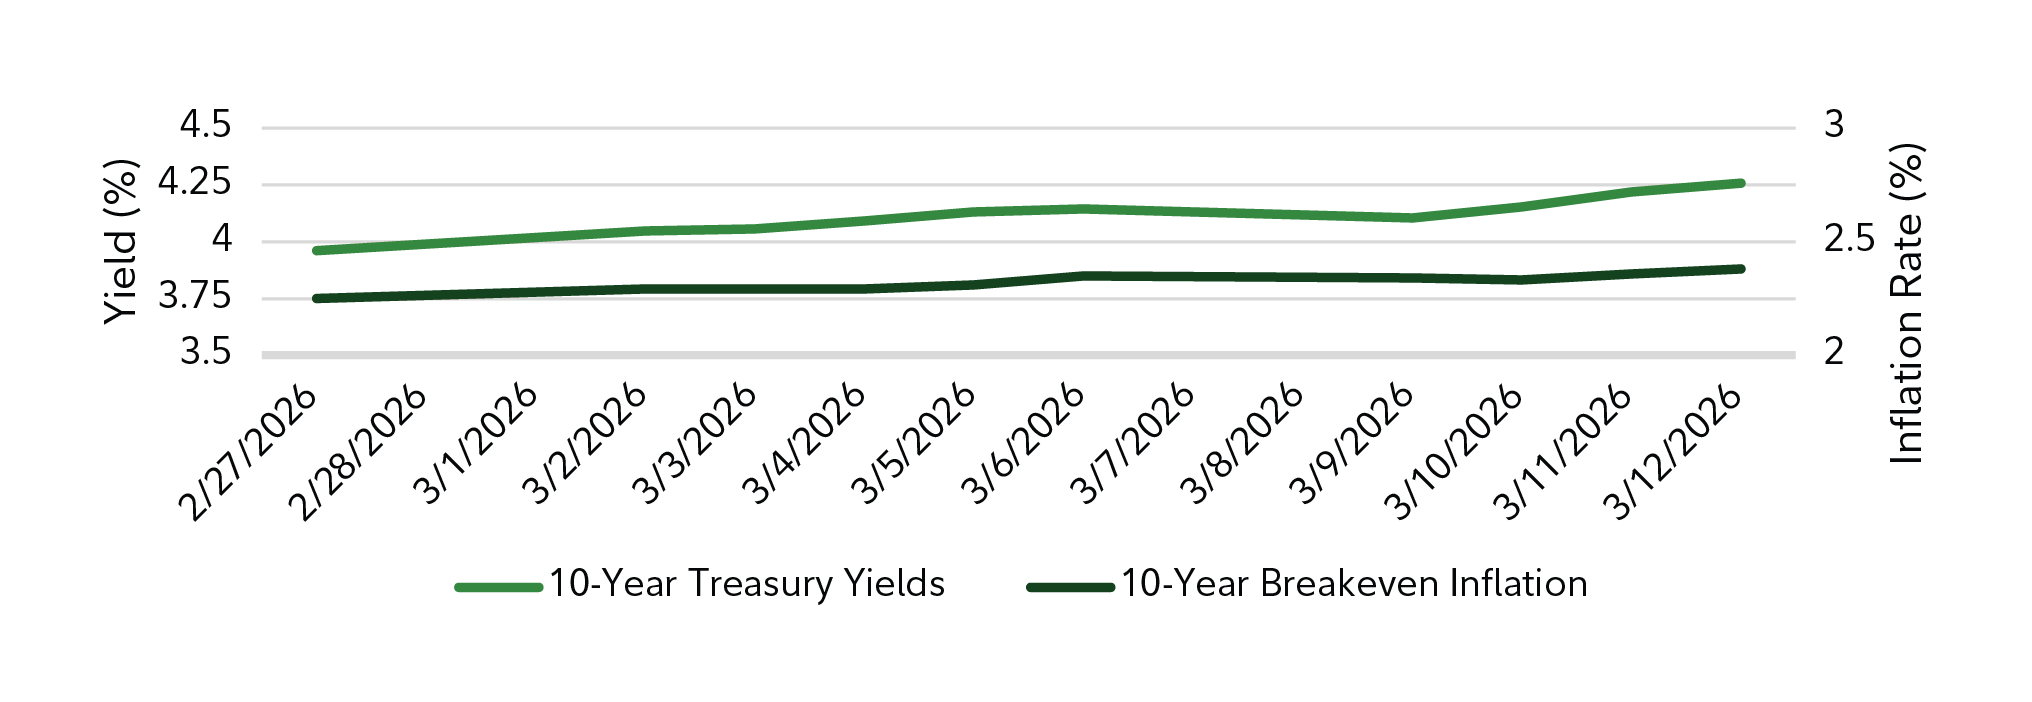
That interpretation shows up clearly in two places. First, while equity volatility spiked following initial escalation, it has not remained persistently elevated, a pattern more consistent with brief geopolitical shocks than with sustained uncertainty. Second, U.S. Treasury yields have edged higher rather than falling, and inflation expectations have remained relatively anchored—signals that bond markets are not pricing a flight to safety or an energy-driven inflation spiral.
Taken together, these cross-asset signals suggest that investors are assuming:
- Energy disruptions will be temporary or manageable
- Broader economic growth will remain resilient
- Policymakers retain sufficient credibility to contain inflation risks
This does not mean risks are absent. If the conflict were to persist or escalate—particularly if energy supply constraints became prolonged—the market narrative could shift quickly toward slower growth and higher inflation. For now, however, asset prices suggest that stagflation remains a tail risk, not the base case, even as oil prices and headline volatility warrant closer monitoring.
It’s important that investors stick with their long-term plans and remain invested in a diverse set of risk assets until more data and developments change the base case. However, we believe it’s important to 1) highlight the potential underpricing of stagflation, 2) place the current geopolitical situation in context with past crises, and 3) offer insights for investors seeking diversification and more-defensive positioning against left tail (low probability, possibly high impact) risks.
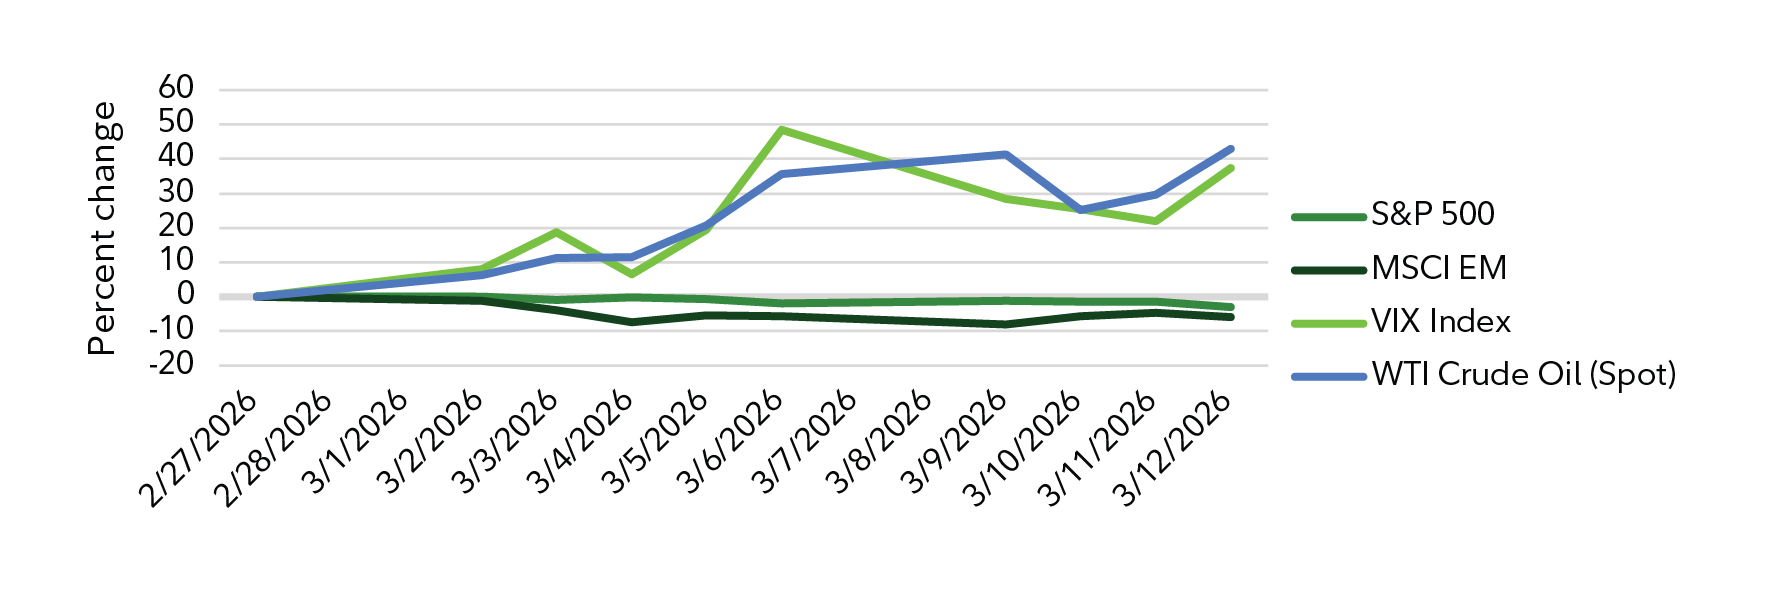
Yet some market indicators have barely budged since February 27. Exhibit 2 shows only a slight increase for 10-Year U.S. Treasury yields (not a flight to safety). Similarly, inflation expectations, reflected by the 10-year breakeven inflation rate, have been relatively stable, showing that the market is not expecting an energy-driven inflation surge. This is interesting as bond yields appear to be more worried about the prospect of higher prices, yet inflation breakevens are less concerned. Typically, during a flight to safety (armed conflict), we would expect to see bond yields fall. We would also expect breakevens to widen as the threat of inflation rises as bond investors demand more yield to compensate for the uncertainty.
Putting historical events in context
The equity market reaction to what the International Energy Agency has called the “largest energy supply disruption in history” has been subdued thus far compared with other recent crises.
For example:
- Russia–Ukraine (Feb. 2022): A regional war and a commodity shock prompted a 14-year price record for Brent crude, a volatility spike for equity markets, and a rally for safe-haven assets, including gold.
- COVID-19 (Feb.–Mar. 2020): Markets rapidly priced in a global shutdown; the S&P 500 fell into a rapid bear market in a matter of days. Credit spreads widened across the credit curve.
- Global Financial Crisis (Sept. 2008): Lehman’s failure triggered a cascading panic. The CBOE Volatility Index began to rise, eventually reaching its highest-ever intraday peak amid interbank stress and credit-market freezes that cascaded into risk markets.
- Oil embargo (Oct. 1973): Energy prices rose rapidly, and West Texas Intermediate crude more than tripled from about $3 a barrel to more than $11 barrel by January 1974. This triggered equity market volatility, rising inflation expectations, and bond-market uncertainty.
Current volatility scenarios
While the cross-asset signals still appear mixed as of mid-March, several risks related associated with stagflation may increase if the conflict continues at a heightened level over the next few months.
- Supply shock risks: Ongoing hostilities could act as a tax on the global economy if the Strait of Hormuz were to remain closed and energy prices stayed elevated for a number of months.
- Demand destruction risks: An energy supply shock could slow consumer and business spending, leading to lower U.S. and global economic growth.
- Persistent inflation: Inflation typically falls when the economy slows, but it may increase if energy prices were to increase the cost of producing and transporting goods, increasing costs for both businesses and consumers.
The possible investment implications of stagflation
Years of U.S. equity outperformance could result in many unbalanced client portfolios being overconcentrated in equities and unprepared for a potential mix of lower economic growth and higher inflation.
Fidelity research conducted in 2024 notes that since 1950, the U.S. has been in a low-inflation environment about 50% of the time, during which equities performed well compared with high-inflation periods. The stagflation scenario (low growth, high inflation) only happened about 23% of the time studied, and in these environments, commodities outperformed U.S. equities, while longer-duration U.S. Treasuries performed worse than both commodities and equities.
It’s been decades since the U.S. experienced a stagflationary environment. There are reasons 1970s-era stagflation is unlikely to reappear because energy markets and the economy are more geographically diverse, the U.S. can tap strategic reserves, and policymakers have better tools to respond.
Even mild stagflation, however, could present headwinds for stock and bond portfolios, especially if the movements of those assets were to become more correlated.
- Central banks might be forced to keep rates higher for longer (or even hike) to fight inflation, despite slowing growth.
- Slower growth and higher borrowing costs could increase credit spreads, leading to lower fixed income returns, as declining prices erode the yield cushion.
- U.S. and international equity markets could face the double headwind of reduced earnings and lower valuations.
Preparing for stagflation tail risk
While stagflation is not the Fidelity Institutional Wealth Adviser team’s base case, client portfolios that are over-allocated to long-duration growth equities, long-duration bonds, or idle cash, may need better inflation resilience.
This may include …
Real Assets
- Energy (oil & gas): Cash flows for energy producers could increase in a prolonged environment of higher prices, helping to mitigate equity risks in other sectors.
- Precious metals (gold): Exposure to gold (accessible to investors in managed futures products) has historically offered a strong inflation hedge.
- Real estate: Select exposure to both private and public real estate could see nominal growth and increasing rents over time.
- Alternative strategies: Many provide exposure to assets that are less correlated to equities (such as managed futures and market-neutral portfolios).
Non-cyclical & value equities
- Value funds and ETFs historically have offered a mix of equities with pricing power that is not as dependent on economic growth as consumer discretionary, information technology, and other cyclical sectors. These non-cyclical, more-defensive sectors include consumer staples, health care, and utilities.
Inflation-aware fixed income
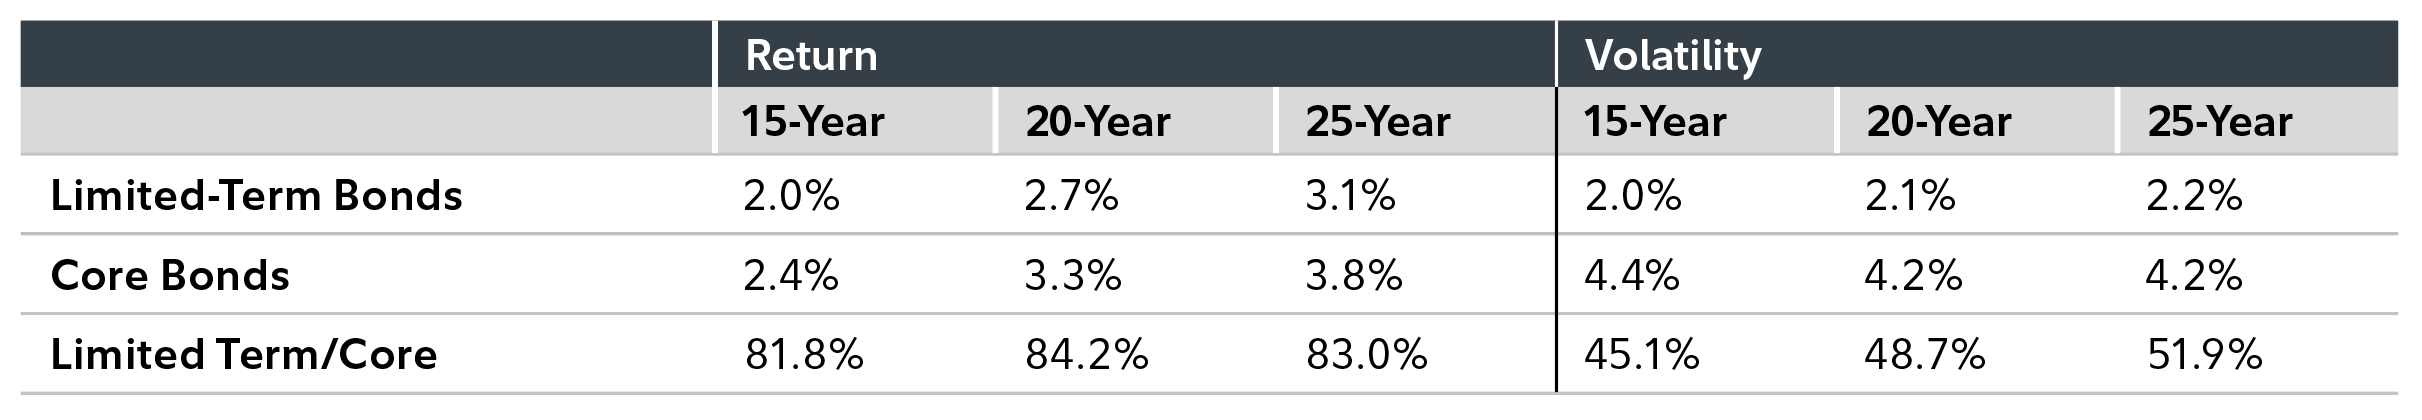
- Some fixed income asset classes have been far less sensitive to inflation compared with the core bond market. These include Treasury Inflation-Protected Securities (TIPS), floating-rate securities, and limited-term bonds. In our research, the latter has produced most of the return of core bonds over time with about half the volatility (Exhibit 3).
Conclusion
Recent price movements present a nuanced picture. Energy markets and measures of equity volatility are conveying heightened risk, while U.S. equities and Treasury markets appear more sanguine, reflecting confidence in economic resilience, policy flexibility, or the transitory nature of the shock. Bothinterpretations may ultimately prove justified—or incomplete.
History suggests that markets often struggle less with pricing the immediate impact of geopolitical events than with assessing their second-order effects on growth, inflation persistence, and asset correlations. Stagflationary environments, while not frequent and not our base case, have historically challenged conventional assumptions embedded in portfolios and market pricing, particularly when inflation pressures persist alongside slowing activity.
Whether current conditions evolve into such a regime remains uncertain. What is clearer is that today’s market signals reflect a relatively narrow set of outcomes at a time when the distribution of risks may bewidening. If markets are correct, recent calm will appear well-founded. If not, adjustment may occur not through abrupt dislocation, but through a gradual repricing of growth expectations, inflation risk, and diversification benefits across asset classes.
Authors
A feature article from our U.S. partners
Christian Pariseault, CFA® | Head of OCIO and Institutional Portfolio Managers
Christian is responsible for the development and implementation of OCIO business strategy, growth targets, and objectives, as well as driving our external brand in the marketplace. He also leads a team of fixed income, equity, asset allocation and alternatives institutional portfolio managers (IPMs), and investment directors who engage with Fidelity's clients to develop investment strategies, discuss current market and investment trends, and help them understand Fidelity's diverse investment capabilities to meet their distinct investment needs.
Mayank Goradia, CFA® | Head of Portfolio Construction Services, FIWA CIO and FIWA Chief Investment Officer
Mayank is Head of Portfolio Construction Services and Chief Investment Officer for Fidelity Institutional Wealth Adviser (FIWA), the registered investment advisor within Fidelity Institutional®. In this role, he leads teams responsible for overseeing the firm’s investment strategy and portfolio construction framework, including strategic and tactical asset allocation. He also oversees fundamental and quantitative manager research, integrating qualitative insights with data-driven analysis to inform manager selection, portfolio design, and ongoing due diligence. In addition, he works closely with intermediary clients on investment consulting, providing guidance on asset allocation, portfolio structure, and risk management across market environment.
Stephen Beck, CFA® | Head of Portfolio Management & FIWA Deputy CIO
Stephen is head of Portfolio Management, co-deputy FIWA CIO for Wealth Advisory Managed Solutions at Fidelity Institutional® In this role, Mr. Beck is responsible for leading the portfolio management group within the FIWA Investment Office. This group is primarily responsible for developing, managing, and representing multi-asset class, open-architecture custom, and turnkey model portfolios.
Nicolas Brunetti, CFA® |
Nicolas is the head of asset allocation and portfolio oversight and analytics, co-deputy FIWA CIO for Wealth Advisory Managed Solutions at Fidelity Institutional® (FI). In his role, he is accountable for asset allocation, quantitative research, and the oversight of analytical approaches used in FIWA’s suite of offerings