
Fidelity Perspectives: What’s in store for 2024
2023 in the rear view
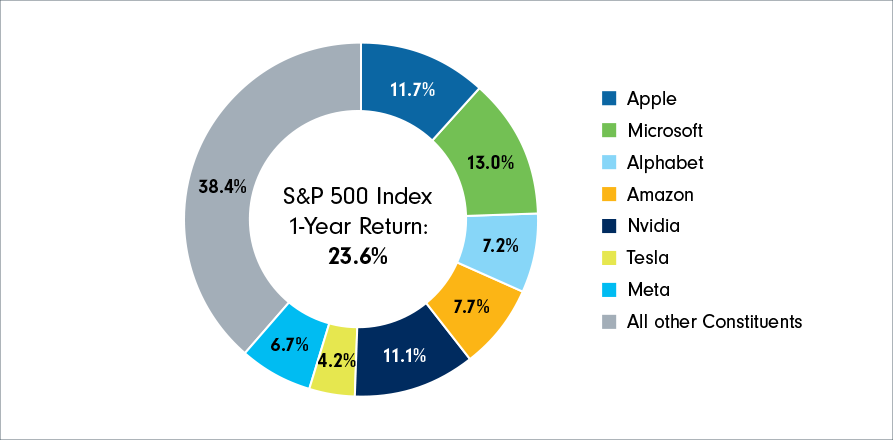
In 2023, equity markets showed resiliency in the face of uncertainty, with the S&P 500 Index returning 23.6% (as at December 31, 2023, in CAD), while the broad U.S. bond market also avoided a third consecutive negative return for the year, with the Bloomberg U.S. Aggregate Bond Index up 2.7% (as at December 31, 2023, in CAD). Several factors contributed to market volatility over the course of the year, including concerns about elevated inflation and rising interest rates, stress in the U.S. and European banking systems earlier in the year, and rising geopolitical tensions around the world.
While equity market gains briefly faded in the third quarter on the expectation of “higher for longer” interest rates, markets continued to rally through the end of the year. What is important to note is that market breadth has been notably narrow in 2023. As seen in Chart 1, the 2023 return of the S&P 500 Index was driven primarily by gains in the “Magnificent Seven” (Apple, Microsoft, Alphabet, Amazon, Nvidia, Tesla and Meta), which experienced a notable surge due to advancements in artificial intelligence (AI), investment in renewable energy and increased demand for digital services.
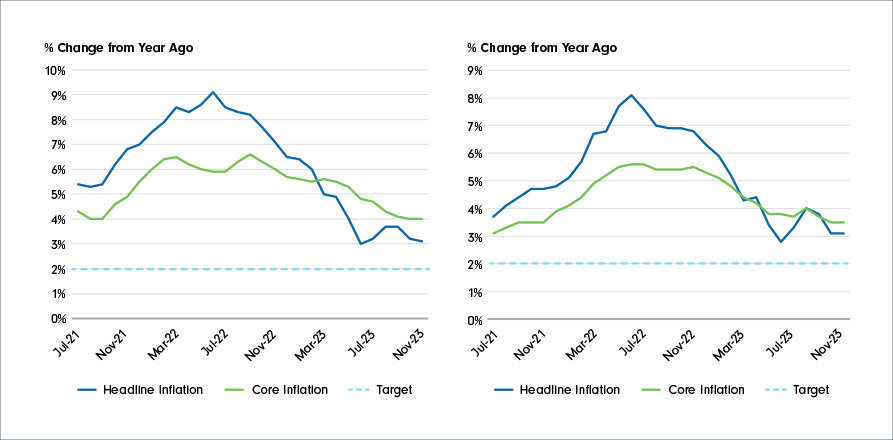
On the macroeconomic front, the trajectory of global central banks’ monetary policy tightening paths was in the spotlight for most investors. Inflation in the U.S. and Canada has moderated throughout the year, with the U.S. Federal Reserve having delivered a total of 525 basis points of interest rate hikes since March 2022, while the Bank of Canada hiked rates by a total of 475 basis points over the same period.
Despite the larger downtrend in headline inflation, core inflation, which is more of a focus for central banks, has remained well above the 2% target in both economies (refer to Chart 2). The effects of central banks’ restrictive policies have noticeably trickled through the Canadian, and, to some extent, European economies, which have seen a slowing economy. The one clear outlier in 2023 was the U.S. economy, which proved to be more resilient than expected, as evidenced by its strong labour market, robust consumer spending and stubborn inflation, which fuelled Treasury yields higher for much of the year.
What does 2024 have in store?
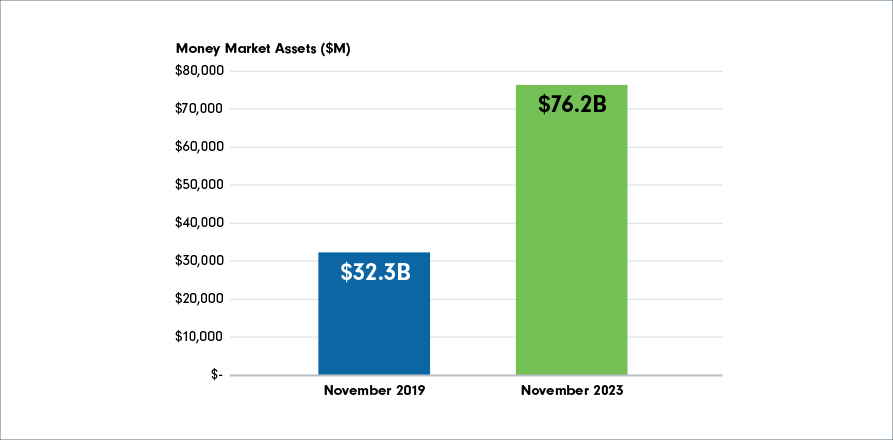
In the face of macroeconomic uncertainty in 2023, Canadian investors piled into cash and cash alternatives, with assets in money market instruments at approximately $76 billion, as shown in Chart 3 (as at November 30, 2023). While an overweight cash position made sense for some investors during rapidly rising rates, this may become more difficult to justify now that U.S. and other developed world interest rates have likely peaked. Cash alternatives have not participated in the equity market rally this year, and with central bank rhetoric finally shifting and market participants debating the timing of interest rate cuts, as opposed to hikes, this may be a good time for investors to re-evaluate their investment portfolios in order to avoid missing out on potential upside in other asset classes.
Several Fidelity portfolio managers have weighed in on what investors can expect in 2024.
Fidelity Canada’s Chief Investment Officer and Portfolio Manager Andrew Marchese observes that: On a macro basis, there is much consternation in the market regarding central banks’ interest rate policy, and what is the potential for continual slowing of the Canadian and U.S. economies as the past rate hikes make their way through the consumer and industrial portions of the economy. He believes examining unemployment rates and their direction may provide the best clue for a soft or hard landing scenario. Rate cuts by central banks may be precipitated by rising unemployment rates, which are typically associated with a more challenging corporate profit backdrop environment.
According to Andrew, factors that have typically performed well against a slowing economic backdrop have traditionally been quality, lower beta and low leverage securities. If the economy continues to slow, the historical trend is for bonds and bond proxies to fare well. If global central banks were to signal that they would begin aggressively cutting rates in 2024, investors should expect to see a change in leadership at some point through the rate cut cycle to early cycle, with smaller-cap, higher-beta securities performing better, invoking the start of a new investment cycle.
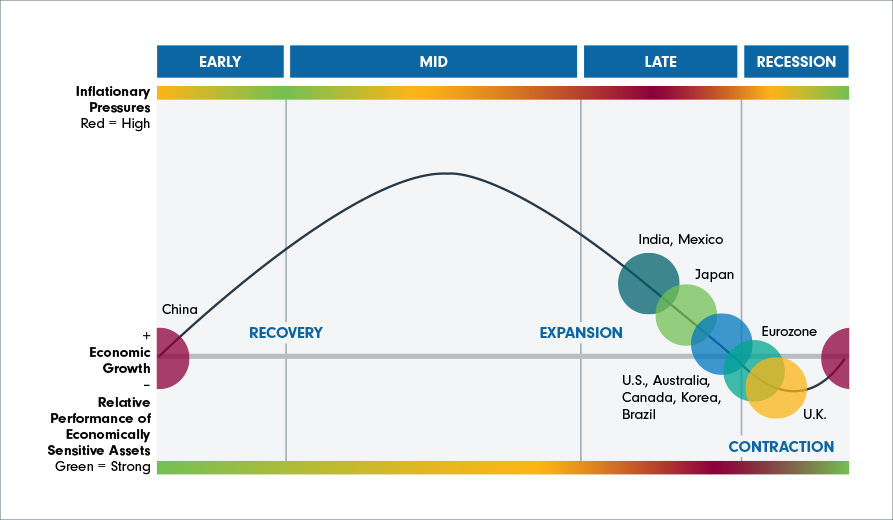
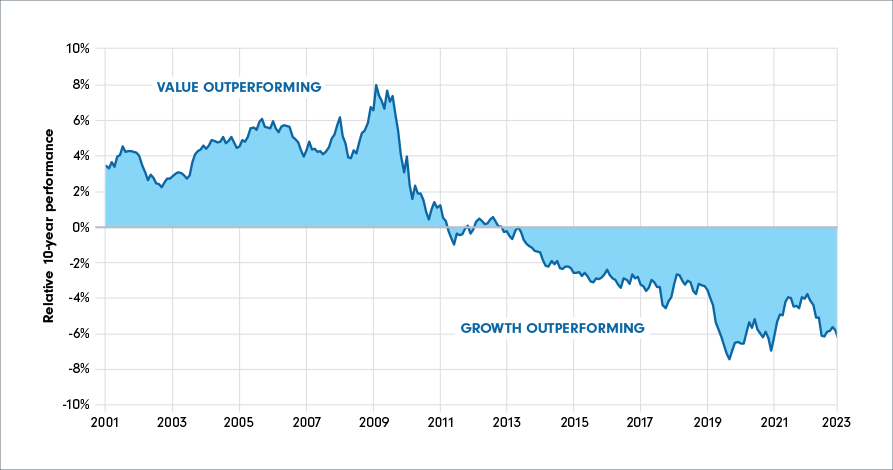
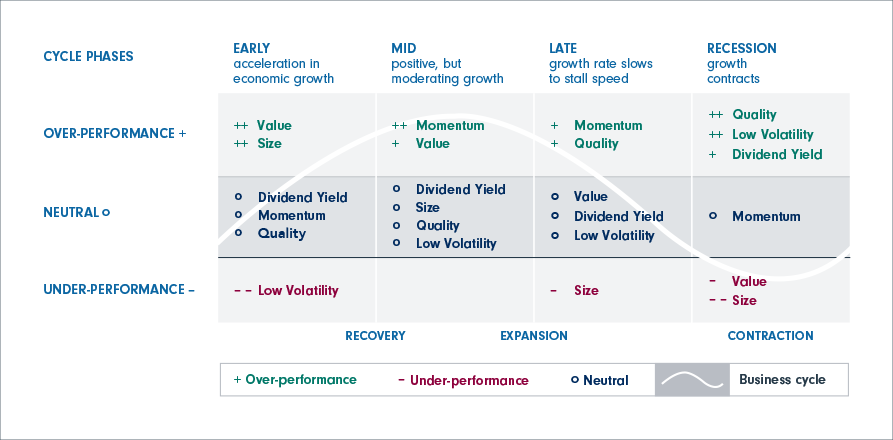
In terms of where we are at in the economic cycle, the developed world seems to have stalled in the late cycle for some time now (refer to Chart 4). The reason for this is an economy that has been more resilient, because real wages have increased this year, coupled with excess spending. Consumers have not curtailed their spending in the face of higher rates and rising prices. In Andrew’s opinion, what needs to be determined is not only whether we are going into a recession, but also what its depth and magnitude will be. A recession is associated with corporate profit contraction and in his view, if a recession were to occur, it will be important to determine the magnitude of the contraction, which is something that Andrew and his team will be closely monitoring.
The Global Asset Allocation team, David Wolf, David Tulk and Ilan Kolet, note that despite the economy’s apparent resiliency, the global economies’ business cycle has continued to advance as major central banks have continued along their tight monetary policy paths. The managers also note that although a recession is still possible, the probability of a soft landing in the U.S. has increased substantially as potential productivity growth may be sufficient to counterbalance recession risk.
The managers continue to hold the view that core inflation (ex-food and energy) remains a challenge for central bank policy makers. While the managers expect the moderating trend in headline inflation to continue, core inflation (ex-food and energy) will be harder to control, in their view, as a result of labour market tightness contributing to elevated services costs. With a soft-landing scenario in the U.S. having a potential higher probability than previously anticipated, but recession risk still not eliminated, the managers have taken a neutral stance with their positioning from a broad asset class mix.
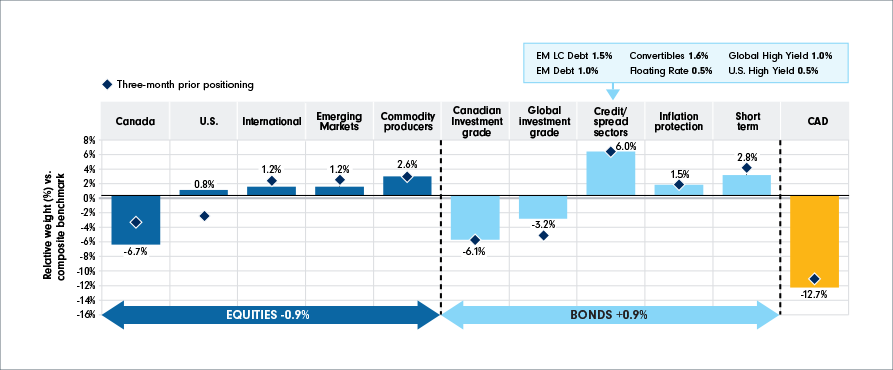
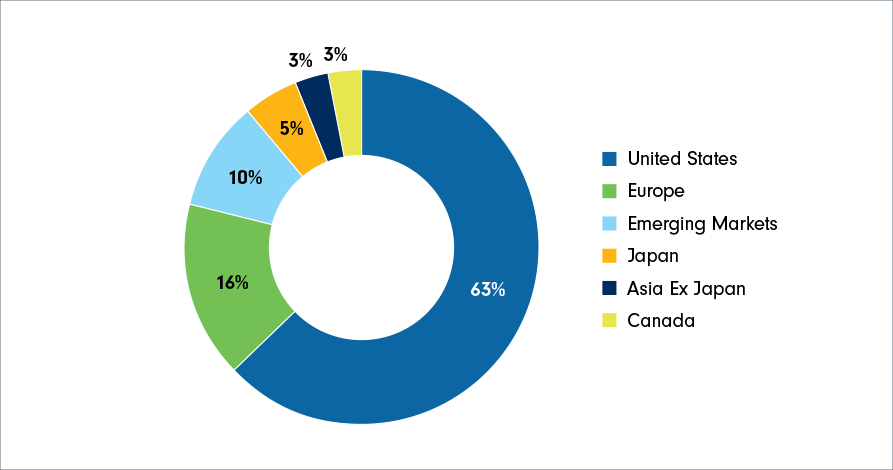
Among equities, the GAA portfolios continue to hold a lower-than-benchmark allocation to Canadian equities, in favour of U.S., international and emerging markets equities, while continuing to hold tactical positions in inflation-sensitive assets such as a gold ETF, commodities-related equities and inflation-protected bonds. In fixed income, the managers continue to hold a lower-than-benchmark allocation to government and other investment-grade bonds, which are higher in duration, in favour of credit spread sector. The managers believe that despite the traditional ‘playbook’ of buying bonds in late cycle, the current environment may present a challenge to that strategy. On the one hand is a potential higher growth rate of the economy, which may limit the scope for yields to fall; on the other hand, if core inflation remains sticky, this will continue to disrupt the stocks-bonds correlation and may require central banks to maintain a higher-for-longer policy stance.
Elevated debt levels pose a vulnerability to the Canadian economy amid the risk of higher interest rates for longer, which is likely to add significant stress to the balance sheets of Canadian households and in turn, to the Canadian economy. The managers continue to appreciate the challenges that Canada may face in the medium term and recognize that the Canadian dollar is a cyclical currency. Accordingly, to maintain diversification and manage risk, the managers maintain underweight exposure to Canadian assets and the Canadian dollar, in appreciation of the asymmetry in risk/reward. Against this backdrop, the managers aim to build portfolios that are resilient in a wide range of outcomes. They believe constructing portfolios that are well-diversified across asset classes, styles and regions is the right way to both protect and grow capital over the long run.
Viewpoints from our fixed income portfolio managers
Portfolio Managers Jeff Moore and Michael Plage note that 2023 remained volatile for fixed income following the back-to-back years of negative returns in 2021 and 2022. As a result of a hawkish Fed and market participants re-evaluating their expectations for further interest rate moves, U.S. Treasury yields were volatile in 2023. The 10-year Treasury yield started 2023 below 3.9%, fell below 3.3% during the regional banking crisis, and surged to 16-year highs in October, reaching 5.0%, as shown in Chart 6.
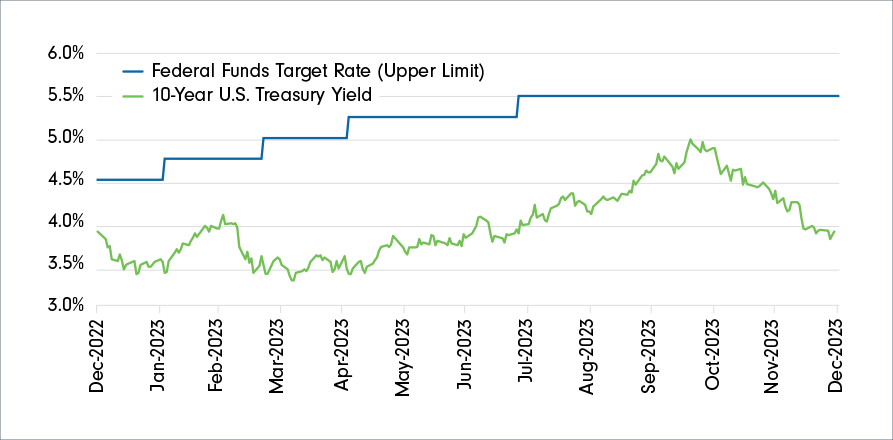
However, yields retreated in November and December, falling more than 100 basis points from the October peak, sparking an “everything rally” for stocks and bonds. The U.S. Aggregate Bond Index gained 4.5% in November, its best month in 38 years, while cash alternatives generally gained less than 0.5%. This month serves as a reminder that reinvestment risk and opportunity costs from owning cash-like investments are important considerations. All five of the managers’ multi-sector strategies offered to Canadian investors also experienced personal bests in November.
Coming into 2024, the managers’ weighting in U.S. Treasuries is the highest ever. Despite the recent rally, yields remain close to 20-year highs, the Fed is credible on inflation, and Treasuries now provide return diversification potential for stocks. With their allocation, the managers are favouring the seven- to ten-year key rates. The managers also remain overweight to leveraged loans, which was one of the top performing fixed income sectors for 2023. If short-term rates are indeed higher for longer, a yield near double digits for this sector could persist for a while. One area the managers have been adding to modestly is high yield. Yields above 8% from this sector are very compelling, and due to a debt maturity wall that generally starts in 2025 and later, default rates should remain low.
The managers believe the bar for the Fed to raise interest rates further from here is very high, and that if owners’ equivalent rent (OER) rolls over, talk of easing in coming periods is a very real possibility. As a result, the managers remain constructive on fixed income for the yield, diversification benefits, and upside potential that a falling interest rate environment could create.
Portfolio Manager Adam Kramer believes that in 2024, continued uncertainty about the U.S. economy’s future trajectory will lead to significant mispricings across a variety of asset classes, creating asymmetric risk reward opportunities on which tactical multi-asset class investors can capitalize. These asset classes that face lower prices over recession fears may be better able to protect on the downside if the economy takes a turn for the worse, but also allow for capital appreciation if a recession does not come to fruition. In Adam’s view, U.S. Treasuries, high yield bonds, and areas within dividend-paying equities present attractive risk reward potential in the new year.
Adam believes U.S. Treasuries, specifically those that have a 5-, 7-, 10-, and 20-year term, are attractive, given the downside protection they currently offer and their potential to generate total returns in the high single digits in the event of an economic downturn. Adam notes that even in the unlikely scenario of interest rates rising further and subsequent price declines next year, these bonds are paying enough interest to offset that decline.
Short-maturity high-yield bonds can provide a compelling alternative to owning the issuing companies’ stocks in 2024, especially if the economy slows and enters a recession. This is because high-yield bond prices will be potentially less volatile than stock prices if earnings decline. Additionally, Adam notes that if high-yield bonds encounter a period of volatility, their relatively high income could provide investors a potential cushion of safety.
Within equities, Adam believes the setup for oil tanker stocks is strong for 2024 and beyond: having enough oil has become a national security priority, and given the geopolitical landscape, tankers now have to travel longer routes to move oil around the world, which may benefit these companies’ revenue. The stocks of gold miners are also attractive in Adam’s view, as both rates and a potential economic slowdown have already been priced into these securities. Adam has also been looking for stocks in industrials, financials, consumer staples, utilities and media that are pricing in too much bad news about rates, a recession, and secular challenges.
Other areas of interest for Adam in 2024 include the fixed-to-floating investment grade preferred stock of large U.S. money center banks and investment grade utilities. Adam views these securities as an attractive way to earn high single digit yields with little duration risk.
Viewpoints from our equity portfolio managers
Canadian equities
Portfolio manager Hugo Lavallée acknowledges the ongoing risks and uncertainties in the current market environment, which underline the importance of remaining flexible in managing his portfolios. Despite the challenges of the current market backdrop, Hugo’s unique contrarian investment style allows him to stay optimistic about companies that have fallen out of favour due to high interest rate sensitivity and slower credit growth. As a fundamental bottom-up stock picker, Hugo prefers to focus on company fundamentals and valuations, instead of macroeconomic trends, to inform his investment decisions.
Therefore, he is actively exploring impacted businesses in areas such as utilities, a highly leveraged sector, cyclicals and discretionary spending. More specifically, he has identified select U.S. discount stores that have been trading at cheap valuations amid concerns about cautious consumer spending. This beaten-down group therefore presents attractive investment opportunities that could become strong compounders over the long-term. Hugo also continues to find opportunities in industrials, and more specifically, U.S. rails. For the past couple of years, rails have been losing market share to trucking as consumers demand faster deliveries. However, Hugo believes that trucking will prove more expensive over time. As companies begin to turn their attention to cost and efficiency, rails could benefit from volume increases.
Hugo notes that volatility often provides an opportunity for active managers to identify the diamonds in the rough that can generate relative value in the long run.
Portfolio Manager Dan Dupont continues to be positioned defensively with monetary tightening throughout 2023 having continued to put pressure on consumers. Accordingly, Dan has maintained a larger-than-benchmark exposure to defensives, such as consumer staples, and has also found opportunities in pipelines, utilities, and telecommunication companies, which have been discounted as market participants scrutinize their ability to withstand high rates. He notes that these areas should perform well if an economic slowdown in 2024 prompts rate cuts by global central banks, given their lower level of economic sensitivity and their position as beneficiaries of lower interest rates.
Dan believes that current U.S. market valuations are generally expensive. Accordingly, he is exploring opportunities in Europe, Canada, emerging markets and Japan with more attractive risk-reward attributes. He notes that the current market stability resembles what was last seen before the COVID-19 crisis, and that bouts of market volatility may be more likely. Such volatility could create more attractive opportunities as valuations are put under pressure, in Dan’s view.
Portfolio Manager Don Newman notes that the dividend investing environment may look a lot better going forward as interest rates have likely peaked and are more likely to head lower in the future. The environment for dividend paying equities has not been as strong, given competing income asset classes, such as bonds, that are offering much higher yields than they have in the past decade. This competition, along with concerns about how higher interest rates may affect company fundamentals, has compressed multiples for dividend paying equities. Despite there having been a headwind on multiples, Don notes that many of the dividend paying equities he follows have seen earnings growth. Against this backdrop, Don has been finding more attractive opportunities among dividend paying equities, which continue to have attractive fundamentals, along with earnings growth, but are now offering attractive dividend yields, due to multiples compression lowering the share price.
Despite the higher-interest-rate environment and the potential for rates to head lower, Don acknowledges that bonds could provide attractive capital gain potential; however, it would also mean yields would come down. In comparison, certain dividend paying equities are offering yields north of 4%, off a lower valuation level and with earnings growth potential, this makes the asset class attractive going forward. Don also notes that dividend paying equity companies that are better managed could also lead to sustainable dividend growth potential. This means that total return potential could come from dividend income and growth, along with multiples re-rating and continued earnings growth. Don is cognizant that there may be companies out there with higher leverage and with a maturity wall to be mindful of, but with proper due diligence and fundamental research, backed by Fidelity’s resources, Don believes skillful security selection could generate strong alpha.
Looking forward, Don believes the dividend equities environment is set up to perform better but proper due diligence is still required as we may enter a slowing environment. Don also notes that if the environment does slow down and interest rates were to be cut, it may allow dividend yielding stocks, which have compressed, to re-rate higher as higher leverage and debt maturity may be less of concern. Don continues to invest prudently, focusing on the strength of balance sheets and overall business quality.

U.S. equities
Early in 2023, Portfolio Manager Will Danoff was confident in the number of emerging opportunities he was seeing at very attractive valuations. Will is growing increasingly optimistic about the underlying fundamentals for his positions in 2024, and continues to see strong potential for earnings expansion. The market drawdown in 2022 led to many opportunities to position the portfolio in leading names at attractive price points. Will believes that the bulk of the interest rate moves have likely taken place and the current high rate of U.S. inflation may be peaking. Better prospects for corporate earnings expansion, along with the potential for a more accommodative monetary policy environment, may continue to provide the needed tailwinds for U.S. equity markets. Will remains focused on an expanding list of investable growth trends, such as artificial intelligence and pharmaceutical innovation that further support a more robust U.S. equity market environment. He is continually focusing on how companies have adjusted to increased interest rates and their capacity to continue to drive sustainable earnings growth in 2024 and beyond.
Will’s investment strategy focuses on understanding “best of breed” companies with strong market positioning that can enable sustainable long-term growth leadership. Mega-cap tech stocks have historically performed well during uncertain periods, and the current macroeconomic uncertainty further supports the strength of larger-cap tech names. Will remains positive on the earnings environment and has leveraged periods of market volatility to increase concentration in his higher-conviction names. Will continues to have a positive outlook on big tech-related companies that are profitable, grow at above-average rates and operate in large and expanding markets. He is finding strength in some of the more growth-oriented areas of the market in a wide variety of sectors due to attractively valued earnings growth potential, investible secular trends, and a potential peak in interest rates.
Despite the challenges posed by macroeconomic uncertainty, Fidelity U.S. All Cap Fund, managed by Portfolio Manager Matt Friedman has demonstrated resilience against volatile market backdrops. Matt focuses on finding high-quality companies that are trading cheaply and that generate sustainable cash flows. He does not attempt to time short-term market movements, but aims to anticipate quality earnings trajectories and understand the value the market is placing on those earnings.
Throughout 2023, the narrative rapidly transitioned from concerns about rising interest rates and slowing economic activity, to favouring rate cuts and long-duration stocks for 2024. Matt, however, remains focused on exploiting valuation dislocations in the market by identifying undervalued equities showing strength in their underlying fundamentals. Matt sees opportunities in overlooked sectors such as financials, utilities, and energy, and aims to leverage favourable valuation dislocations in smaller cap companies.
In a market where growth equities have generally outperformed, Matt remains consistent in his approach in searching for cheap, high quality U.S. equities. He notes that moderate economic growth amidst an increased-interest-rate environment may continue to boost value-oriented companies with more sustainable near-term earnings trajectories. Fidelity U.S. All Cap Fund’s focus on mid-cap value companies may help provide diversification benefits for investors looking to invest in a U.S. equity landscape that is primarily dominated by a large cap growth bias. Over his career, Matt has consistently maintained a focus on cheaply trading, cash generative business models, especially during uncertain market environments. Overall, Matt is optimistic about the Fund's positioning, as he continues to seek to take advantage of the valuation dislocations he’s seeing across a wide variety of U.S. equity sectors.
Global equities
Portfolio Manager Mark Schmehl believes that the macroeconomic backdrop remains challenging due to many underlying cross-currents. Concerns remain regarding an impending recession, but given the resiliency of U.S. consumers who have not curtailed their spending in the face of higher rates and rising prices, Mark believes that if a recession were to occur, it would not be as severe as the 2008 global financial crisis and other more typical recessions. While he is macro aware, he also knows he can't predict the magnitude, duration, or timeline of any recession; instead, he has been focusing on earnings growth. In his view, earnings growth is the key dimension to look at when picking stocks as higher interest rates are eventually going to fall. As a result, he is looking to own stocks with the fastest earnings growth and that can outpace the multiple compression they are seeing from rising rates.
Specifically, he has been looking for areas that will be rewarded by the market over the long term and Artificial Intelligence (AI), in his view, represents one such area that he has been exploring very actively. Mark believes AI could be a durable, long-term trend with powerful applications across the economy and it could revolutionize the way businesses operate. Mark is based in California which gives him close access to the management teams of transformative companies; he and his team have been spending a considerable amount of time finding good ideas in the AI space.
Mark is also finding opportunities in the electrification space. As environmental concerns intensify, he believes electrification will emerge as a crucial solution for reducing carbon emissions. Recently, he has also been paying close attention to the health care sector, particularly weight loss drugs. In his view, certain companies that offer weight loss drugs could be standout performers in the sector. These weight loss drugs could transform the health care industry and the implications of this transformation have not yet been fully appreciated, which could pose both challenges and opportunities for investors in Mark’s view. Overall, Mark has been finding a lot of interesting ideas in the current market environment and remains flexible to reposition his portfolios to capture emerging trends.
As the backdrop remains uncertain and consumers continue to digest higher prices and rising interest rates, the portfolio managers of Fidelity Global Intrinsic Value Class, Sam Chamovitz, Morgen Peck and Salim Hart are looking for companies that demonstrate adaptability and resilience in a constantly changing market. The managers believe they are well positioned to navigate this volatile environment by providing exposure to both value and quality. When building an investment thesis, they are thinking as potential owners of the business for the next three to five years.
The managers maintain exposure to certain high-quality defensive businesses in health care, particularly health insurance companies, and in the consumer discretionary sector, such as auto component names. According to the portfolio managers, new opportunities are arising as many retail companies are forced to liquidate their inventory at suboptimal margins due to excess inventory and slow demand. In addition, Sam, Morgen and Salim remain optimistic about the energy sector, because they believe tight energy supply will continue to support oil prices. In their view, the energy supply will likely be limited with the increased trend of energy companies opting to allocate more capital to investors in the form of dividends or share buybacks, rather than using it for oil and gas exploration and production.
The portfolio’s current geographic tilt is composed of a large overweight in Japan, Asia ex. Japan and a smaller overweight in Europe where the managers are finding overlooked opportunities at attractive valuations, funded by a significant underweight in the U.S. The global opportunistic aspect of the Fund gives the managers the flexibility to generate the best risk-adjusted returns that is aligned with their process.
Portfolio Managers Connor Gordon and Chris Maludzinski believe that in 2024, the market environment will remain delicate as the market has priced in the normalization of inflation and monetary policy. The managers also note that macro volatility is creating significant fundamental dispersion, which should be favourable for bottom-up stock picking. While rates have come off their peak, they continue to remain elevated relative to the past 15 years, which could continue to lead to volatility and mispricings in the small cap space given elevated debt levels and a slowing of economic growth. The managers generally favour profitable, predictable, growing businesses with the ability to manage through all economic environments. Small caps in particular offer resilient business models with the ability to grow regardless of macroeconomic cross-currents, and the managers place a great emphasis on finding leaders within their industry with the ability to gain market share. Connor and Chris seek to use volatility to their advantage, buying stocks when they are mispriced and trading at a discount to intrinsic value.
Connor and Chris remain excited by the breadth of the global opportunity set, which allows them to unearth opportunities across multiple geographies. Specifically, the managers see idiosyncratic opportunities not just in the U.S., but also in Europe and Japan, which have been particularly dislocated post-COVID. From a portfolio perspective, the managers seek to maintain a balanced portfolio of high-conviction ideas trading at attractive valuations. Connor and Chris use volatility to upgrade the quality and prospective risk-return ratio of the portfolio. The team remains positive on prospects for the portfolio in 2024 and looks forward to working with the Fidelity research team to capitalize on mispricings around the globe.
Emerging markets equities
As global rate hiking cycles begin to peak and emerging market valuations sit at below average levels, Portfolio Manager Sam Polyak continues to position Fidelity Emerging Markets Fund more cyclically, with the asset class exhibiting potential for tailwinds in 2024. This cyclical exposure is mainly to opportunities in China, which he believes are currently trading at discounted levels. In the manager’s view, China is currently poised to rebound in 2024 as the country could see several tailwinds. China currently has the ability to cut rates and impose government stimulus as the country experiences slower growth. Furthermore, Chinese consumers have accumulated pent up savings which may increase domestic demand as consumers gain confidence and seek to spend these savings.
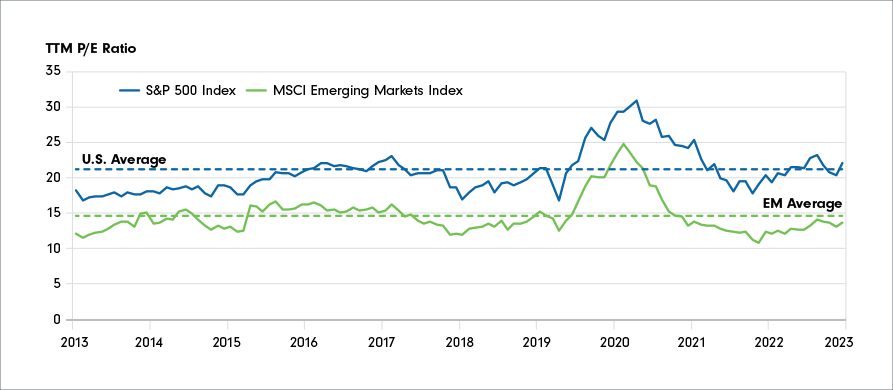
Further weakening in the U.S. dollar, continued EM growth expectations and slowing inflation may provide further tailwinds in 2024. This presents a unique opportunity to invest in rapidly growing emerging market economies trading at historically cheap levels, while also adding diversification to client portfolios. Sam looks to identify new opportunities on the basis of companies’ fundamental drivers of value, rather than basing investment decisions on macro factors which are often volatile, especially in the EM asset class.
Alternatives
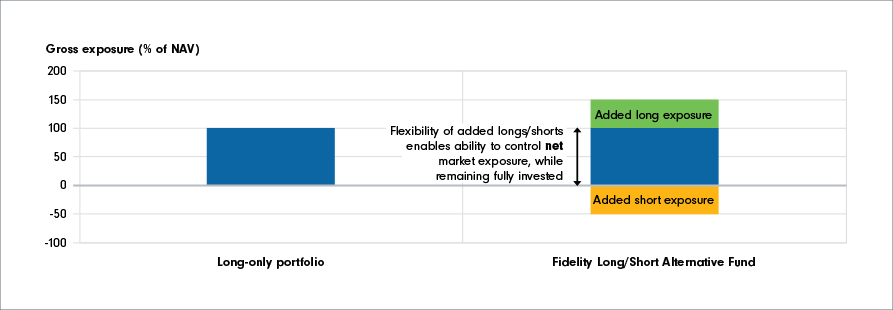
Portfolio Manager of Fidelity Long/Short Alternative Fund David Way is optimistic about the investing environment for liquid alternatives, given the opportunities for finding attractive long investments and balancing this optimism with a robust short portfolio targeting companies that face underappreciated challenges in the ever-changing economic and competitive environment. David is focused on long exposure to businesses that benefit from growing end markets (e.g. software, some financial services and industrial manufacturers) and those companies gaining market share and launching new products in select pockets of consumer and industrial end markets. David believes that investing success in 2024 will come from balancing optimism about a renewed economic cycle and appropriate caution surrounding the 2024 U.S. election cycle and lingering interest rate and other economic uncertainty. There remain many areas of dislocation in the broader market that David expects to improve.
Short selling is an important feature of David’s ability to manage risk and widen the opportunity set for identifying and capturing alpha. Speculative and unprofitable businesses have benefited from renewed investor optimism and in 2024, David expects these companies to disappoint investor expectations for accelerated revenue and profit improvement. Lower-quality businesses with now-high valuations have little margin for error in the new year, presenting ample and attractive opportunities to construct a short portfolio that could provide protection against market volatility while contributing to overall fund returns.
According to Portfolio Manager Brett Dley, manager of Fidelity Market Neutral Alternative Fund, we could be in the midst of a recession or a soft landing in 2024, but we are likely to end the year in a better place than where we started. He believes interest rates have peaked and that they might not come down as much as anticipated.
Brett continues to focus on relative valuations in the current market environment. In his view, stocks that have been hit hard ahead of an expected recession could emerge as winners, as negative earnings revisions come to end and valuations are extremely cheap. Examples include cyclical sectors, such as consumer discretionary and industrials. On the other hand, defensive names, such as select companies in consumer staples, may tread water, given they are expensive and widely owned. While the valuations for defensive names have increased due to the level of safety they offer, Brett thinks they will lag in the next one or two years as that level of safety comes to be less appreciated by the market. In Brett’s opinion, it is now time to think about adding risk to equity portfolios.
Factor-based investing
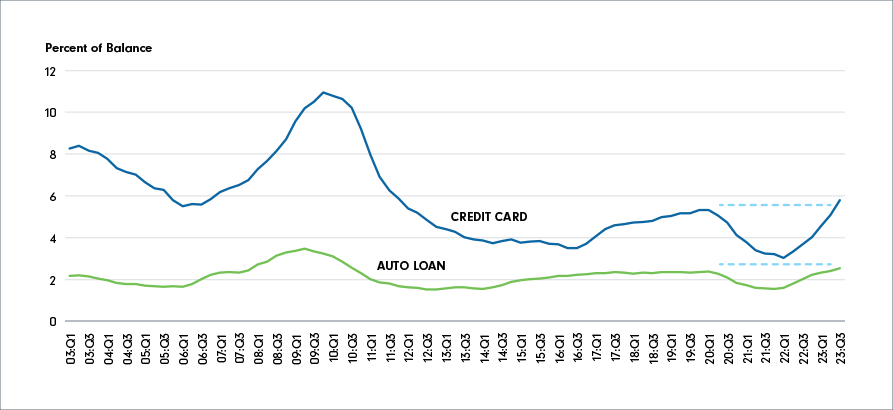
Fidelity Management & Research (FMR) Head of Quantitative Index Solutions, Bobby Barnes, notes: Recent economic data continues to point to inflation easing toward the Fed’s 2% target, and ISM Manufacturing PMI month-over-month headline prints are improving. However, Bobby believes that many of the interest rate hikes conducted by Fed Chair Jerome Powell have not yet been fully digested by the economy, as it normally takes 12-18 months to see the impact of monetary policy. On the consumer side, credit card delinquencies in the U.S. have risen over the past year, as seen in Chart 13, and Bobby expects these delinquencies to persist and rise further in 2024. Further, he stresses the need to remain cautious, as things could potentially unwind at a fast pace.
Bobby believes that the narrow leadership we’ve seen in equity markets in 2023 could continue its upward trend in 2024, as improved earnings data continue to justify the premium. Additionally, he believes we are in an elongated late cycle and favors quality stocks, owing to their resilient earnings. However, Bobby also expects the low volatility factor to become attractive if the economy goes into a recession in 2024.
Bobby believes the case for a 60/40 portfolio is now compelling. With the Fed having conducted one of the most rapid rate hike cycles in history, yields on long-term Treasuries are currently near decade highs. With the Fed having pointed to rate cuts in 2024, Bobby believes that longer-duration assets could potentially see equity-like returns. For equity allocation, Bobby continues to favour U.S. stocks over global markets.
What investors should keep in mind as 2024 unfolds
As we’ve turned the page on another calendar year, the debate which will likely dominate markets in 2024 revolves around the potential for interest rate cuts by global central banks, with the focus for investors shifting from "how high can policy rates go?" to "how long can policy rates remain tight?"
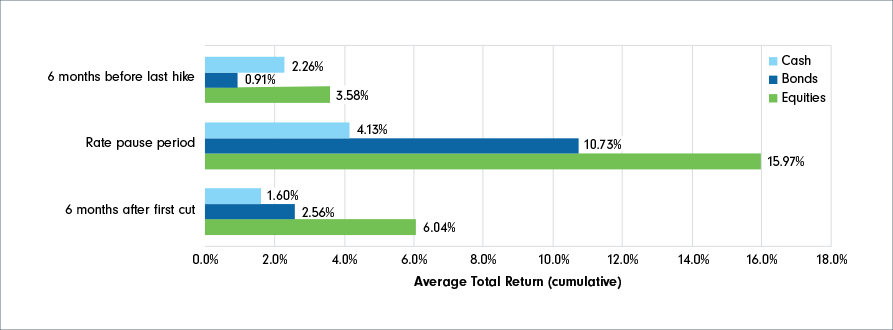
It remains to be seen whether market participants’ expectations about the scope and speed of monetary policy easing will materialize; however, Chart 15 shows that investors sitting in cash in 2024 may risk missing out on bond and equity market returns. Notably, in the previous five hiking cycles since 1990, the U.S. Fed paused an average of 10 months between its last hike and its first cut. Equities and bonds have shown positive returns, on average, immediately before the last rate hike of a cycle, between the last rate hike and the first cut, as well as immediately after the first rate cut of a cycle. Even more noteworthy, rate pauses have paid off for investors more than easing periods, with equity and bond returns having been between 8% to 10% higher, on average, during the pause period than in easing periods immediately following the first cut.
Regardless of the paths that economies and markets could take over the next year, investors should remember not to lose sight of their long-term investment goals as they navigate markets in 2024. Staying invested, maintaining diversification in your portfolio and working with a financial advisor can help manage short-term risks while pursuing long-term investment goals.
For more information, please visit fidelity.ca or contact your Fidelity team.