What is a yield curve?
The yield curve is one of the most important tools to gauge investor sentiment regarding interest rates. If you understand how to interpret a yield curve, it may even be used to help gauge the direction of the economy.
People often talk about interest rates as though all rates behave in the same way. The reality, however, is much more complex, with rates on various bonds often behaving quite differently from one another, depending on their maturity. A yield curve is a way to easily visualize this difference: it’s a graphical representation of the yields available for bonds of equal credit quality and different maturity dates.
A yield curve is a way to measure bond investors’ feelings about risk, and can have a tremendous impact on the returns you receive on your investments. And if you understand how it works and how to interpret it, a yield curve can even be used to help gauge the direction of the economy.
Most often the universe of bonds represented by a particular yield curve is limited by bond type. The one you’ll probably hear referred to most often, as “the yield curve” or “the Canadian yield curve,” reflects the short-, intermediate- and long-term rates of Canadian government bonds. The Canadian yield curve is often referred to as a proxy for investor sentiment on the direction of the economy. A yield curve can refer to other types of bonds, however, such as provincial yield curves, or reflect the narrower universe of a particular issuer, such as the RBC or Enbridge yield curve.
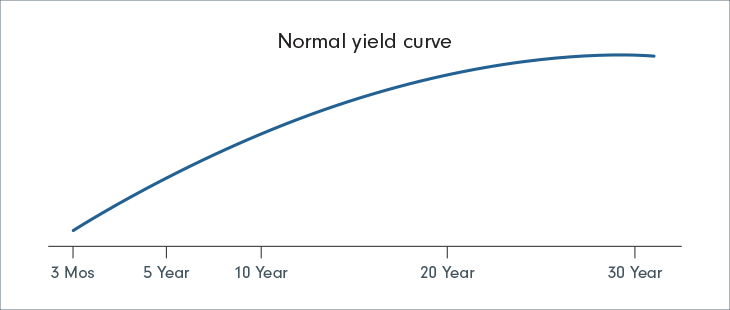
The normal yield curve
In general, short-term bonds carry lower yields to reflect the fact that an investor’s money is at less risk. The thinking behind this is that the longer you commit funds, the more you should be rewarded for that commitment, or for the risk you take that the borrower may not pay you back. This is reflected in the normal yield curve, which slopes upward from left to right on the graph as maturities lengthen and yields rise. You’ll generally see this type of yield curve when bond investors expect the economy to grow at a normal pace, without significant changes in the rate of inflation or major interruptions in available credit. There are times, however, when the curve’s shape deviates, signalling potential turning points in the economy.
Steep curve
Since 1990, a normal yield curve typically has yields on 10-year Government of Canada bonds 1.4 percentage points (also known as 140 basis points) higher than the yield on 3-month bills. When this “spread” gets wider – causing the slope of the yield curve to steepen – long-term bond investors are sending a message about what they think of economic growth and inflation.
A steep yield curve is generally found at the beginning of a period of economic expansion. At that point, economic stagnation will have depressed short-term interest rates, which were likely lowered by the Bank of Canada as a way to stimulate the economy. But as the economy begins to grow again, one of the first signs of recovery is an increased demand for capital, which many believe leads to inflation. At this point in the economic cycle, long-term bond investors fear being locked into low rates, which could erode future buying power if inflation sets in. As a result, they demand greater compensation – in the form of higher rates – for their long-term commitment. That’s why the spread between 3-month bills and 10-year Government of Canada bonds usually expands beyond the “normal” 140 basis points. After all, while short-term lenders can wait for their short-term bonds to mature in a matter of months, giving them the flexibility to buy higher-yielding securities should the opportunity arise, longer-term investors don’t have that luxury.
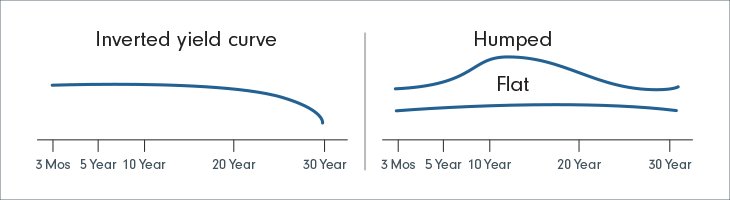
Inverted curve
At first glance, an inverted yield curve seems counterintuitive. Why would long-term investors settle for lower rewards than short-term investors, who are assuming less risk? The answer: When long-term investors believe that this is their last chance to lock in current rates before they fall even lower, they become slightly less demanding of borrowers. As you might expect, since lower interest rates generally mean slower economic growth, an inverted yield curve is often taken as a sign that the economy may soon stagnate. While inverted yield curves are rare, investors should never ignore them. They are very often followed by an economic slowdown – or an outright recession – as well as lower interest rates along all points of the yield curve.
Flat or humped curve
Before a yield curve can become inverted, it must first pass through a period when short-term rates rise to the point that they are closer to long-term rates. When this happens, the shape of the curve will appear to be flat or, more commonly, slightly elevated in the middle.
While it’s important to note that not all flat or humped curves turn into fully inverted curves, you shouldn’t discount a flat or humped curve. Historically, an economic slowdown and lower interest rates have followed a period of flattening yields.
Using yield curves
The shape of the Canadian yield curve is used to help determine the current and future strength of the economy; the Canadian yield curve also occupies a special place compared with all other yield curves because it is generally regarded as the “benchmark curve.” Yields on Canadian government bonds and other securities are generally among the lowest because they’re backed by the full faith and credit of the Canadian government. This allows bond investors to compare the Canadian yield curve with those of riskier assets, such as the yield curve of provincial bonds or of A-rated corporate bonds, for example. The yield difference between the two is referred to as the “spread.” The closer the yields are together, the more confident investors are in taking the risk of a bond that is not government-backed. The spread generally widens during recessions and contracts during recoveries.

