What makes bonds different than GICs?
What is a bond?
A bond is an investment in which an investor loans money to an entity for a defined period of time, typically at a fixed interest rate. Issuers include federal, provincial, state and municipal governments or their agencies, corporations, foreign governments and even private institutions. Bonds are considered to be less risky than stocks and can provide a source of steady, predictable income in the form of interest, or coupon payments. The value of a bond may fluctuate based on changes in prevailing interest rates, credit quality and other factors. Bond funds pool money from many investors to buy individual bonds according to the funds’ investment objectives.
When you purchase a bond, you are lending money to the issuer, generally in exchange for periodic interest payments and the return of principal at maturity. Zero-coupon bonds do not provide regular interest payments, but are offered at a deep discount and pay all the accumulated interest at maturity. The issuer is responsible for paying any interest and principal to the bondholder in accordance with the terms of the bond agreement. Bonds can be an important part of a diversified investment portfolio, because they typically exhibit low or negative correlations to stocks, and may provide a steady stream of income, in addition to the potential for capital appreciation. However, it is important to carefully consider the creditworthiness of the issuer and the terms of the bond before making an investment. The financial health of the issuer determines how highly (or not) the bonds are rated.
Higher-rated bonds are considered to be safer, and therefore pay less interest, while lower-rated bonds pay higher interest rates to compensate investors for taking on more perceived risk. As mentioned previously, an issuer’s credit rating can change in either direction over time.
How are bond prices inversely correlated with prevailing yields?
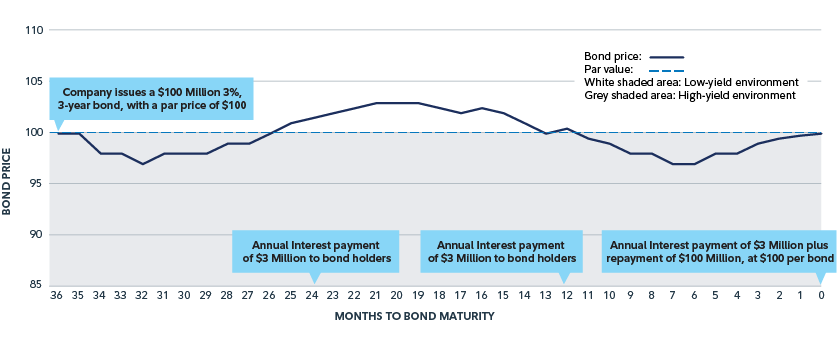
Assume a hypothetical Canadian company issued $100 million of bonds, with a par value of $100, paying a fixed coupon of 3% for three years.
How does the price of the bond change over time?
If prevailing yields are the same as the annual interest, or “coupon” rate, of the bond, the price will stay at $100. However, if prevailing yields increase, as they did in 2022, investing in a bond that offered only a 3% coupon payment each year becomes less attractive, causing bond prices to trade below par, or below $100. As we get closer and closer to maturity, the price of the bond will converge with its par value when the hypothetical Canadian company is required to pay the $100 million back to its investors, at $100 per bond. This effect is called “pull to par.” Today, bonds are attractive, because many are trading below par; therefore, a bond investor’s total return is made up of both the annual coupon payments and the capital appreciation from the pull-to-par effect.
The reverse is true when prevailing yields decrease, as they did in 2019 and 2020. Once prevailing yields fall below the annual coupon payment of a bond, holding that bond paying 3% per year becomes more attractive, causing bond prices to trade above par, or above $100.
Environment |
Price |
Prevailing yields > Coupon on bond |
Below par/below $100 |
Prevailing yields = Coupon on bond |
Par/$100 |
Prevailing yields < Coupon on bond |
Above par/above $100 |
The chart below illustrates this, and shows that
• Bond prices are inversely correlated with prevailing yields.
• Prices fall when yields rise.
• Prices rise when yields fall.
• Prices approach par value upon maturity.
Bond prices move over time, but are eventually “pulled to par”.
Prices are inversely correlated to prevailing yields: falling when yields rise, and rising when yields fall.
Hypothetical 36-month bond price change over time
Three reasons bonds are better than GICs
1. Liquidity
Another benefit of buying bonds is the daily liquidity and flexibility they add to your portfolio. Remember March 2020, when U.S. equities (as measured by the S&P 500 Index) fell by over 30%? Had your money been in a non-redeemable GIC, you wouldn’t have been able to rebalance your portfolio and take advantage of the buying opportunity in stocks. Investors holding bonds, on the other hand, would have been able to rebalance their portfolios, using their bond allocation as a source of funding.
2. Upside potential
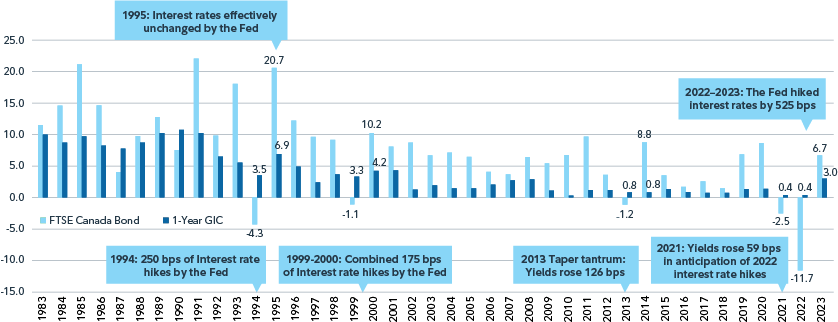
The chart below looks at the last 41 years. To summarize:
• Canadian bond returns were higher than one-year GICs in 34 of the last 41 years, representing 83% of the time.
• Bonds had negative returns in only five of the last 41 years: 1994, 1999, 2013, 2021 and 2022.
• Bonds rebounded in the years following negative returns, earning more than double the return of GICs in 1995, 2000, 2014 and 2023.
Why did bonds significantly outperform GICs during the years following negative bond year returns?
Remember the inverse relationship between prevailing yields and bond prices described earlier? The U.S. Federal Reserve (the Fed) increased interest rates by 2.5%, or 250 bps, in 1994, causing downward pressure on bond prices; hence the negative return, causing bond prices to trade below par. In 1995, interest rates were effectively unchanged, which was positive for bonds.
What history also tells us is that over 41 years, Canadian investment-grade bonds, as represented by the FTSE Canada Universe Bond Index, earned on average 7.42% per year. During that time, the average one-year mortgage rate was 6.50%, and the average one-year GIC rate was 3.86%. Looking into 2024, you should expect to earn roughly 5.00% (pretax) for a one-year GIC (according to ratehub.ca) and pay over 7.50% for a one-year mortgage (according to the Bank of Canada). The only uncertainty is what you will earn on your bond portfolio. However, given most rate hikes are now behind us (the Fed hiked interest rates by 525 bps in 2022–2023), it is likely bonds will perform more normally. Based on 41-year averages, this could be higher than both the current GIC and one-year mortgage rates.
Over 41 Years, Canadian bonds outperformed 1-Year GIC's 83% of the time.
The average excess annual return for Canadian bonds was 356 bps per year.
Tax efficiency in non-registered accounts
If you can buy a one-year GIC paying 5% or a one-year corporate bond paying 5%, shouldn’t you just buy the GIC, because its guaranteed? Not exactly: remember the hypothetical Canadian company mentioned above? Given the sharp rise in interest rates that occurred in 2022, most bonds today are trading below par. What that means is your total return will be made up of interest and capital gains, while a GIC’s return is made up solely of interest, and therefore is taxed at the highest rate.
Below is an example of a bond offered by a $14 billion Canadian packaged foods company, Bond A, and its pricing characteristics from December 2022. This is an investment-grade bond paying annual coupon payments of 2.83%, and trading below par, at $97.77. The yield to maturity (YTM) was 5.06%, which is in line with a 5.05% GIC. However, the after-tax return for the bond becomes 2.99%, while the GIC’s return falls to only 2.40% after tax, or 0.59% less than the bond. In fact, the net after-tax income is $5,906 more for the bond than for the GIC.
Why the drastic change? Part of the total return from the bond comes from capital gains, not income. As a result, the blended tax rate is only 41% for the bond, but it’s 53% for the GIC.
After-tax returns for bonds are better than for GICs.
In a non-registered account, a discount bond with a YTM similar to that of a GIC can have a higher after-tax return (ATR), because 50% of capital gains are taxable.
|
Bond A |
GIC |
Difference between bonds and GICs |
|
Characteristics |
Term |
1-year |
– |
|
YTM |
5.06% |
5.05% |
0.01% |
|
Maturity |
$100 |
– |
||
Price |
$97.77 |
$100 |
– |
|
Coupon |
2.83% |
5.05% |
– |
|
Investment |
$1,000,000 |
– |
||
Yield |
Coupon Yield |
$28,300 |
$50,500 |
– |
Price/Roll Yield |
$22,300 |
– |
– |
|
Total Yield |
$50,600 |
$50,500 |
– |
|
Tax Efficiency1 |
Tax On Income |
$14,869 |
$26,533 |
– |
Tax On Capital Gains2 |
$5,858 |
– |
– |
|
Total Tax Paid |
$20,727 |
$26,533 |
-$5,806 |
|
Blended Tax Rate |
41% |
53% |
-12% |
|
Net Income After-Tax |
$29,873 |
$23,967 |
$5,906 |
|
After-Tax Return |
2.99%3 |
2.40% |
0.59%4
|
|
Source: Bond A from a $14 billion Canadian packaged food company, with an investment-grade credit rating and a 5.06% YTM from Bloomberg, as at December 2, 2022, matures on November 21, 2023. One-year GIC rate of 5.05% was offered by BMO Investorline on December 5, 2022, making annual payments, and is non-cashable. The 52.54% tax rate is the 2023 provincial weighted average top marginal tax rate as at January 2023.
- The blended tax rate is lower for bonds than GICs.
- GIC’s earn income which is fully taxed, while bonds earn both income and capital gains, which are taxed more favourably.
- The bond’s 2.99% ATR is 22% higher than the GICs 2.40% ATR.
- The bond’s ATR is 0.59% more than the GIC.
Three scenarios for 2024 and the implications for bonds
1. Bullish: We enter a recession, and central banks cut interest rates by more than is already priced in, which is positive for bond prices.
2. Base case: Interest rates are cut as the market is anticipating, and bonds continue earning high yields.
3. Bearish: Inflation gets worse and central banks refrain from cutting interest rates, causing yields to rise – a headwind for bond prices.
The Bank of Canada has held interest rates steady since July 2023 and signalled that its current policy rate is sufficiently restrictive to tame inflation. The market is now pricing in several cuts over 2024, which should be a positive environment for fixed income, given the bullish and base-case scenarios listed above.
To conclude
Rising interest rates and bond yields were headwinds for fixed income in 2021 and 2022, but remained relatively unchanged in 2023, helping broad market investment-grade bond indexes snap a two-year losing streak. Even after a strong fourth quarter, both U.S. and Canadian investment-grade bond indexes are still below their highs seen in 2020, partly because longer-term bond yields are still well above longer-term averages. Combined, these points suggest there is runway for the recent strength seen in the fixed income asset class to continue.
Talk to your financial advisor today to learn more about Fidelity’s professionally managed bond funds. Compared with GICs, these funds can offer better daily liquidity, upside potential and tax efficiencies for your overall portfolio.
Sources
One-year mortgage rate of 6.09% from BOC website, as at November 30, 2022.
https://www.bmo.com/main/personal/investments/online-investing/investorline/self-directed/
One-year 5% GIC rate based on 12 GICs offering one-year rates of at least 5%, as at December 12, 2022.
https://www.federalreserve.gov/monetarypolicy/files/fomcprojtabl20221214.pdf
December FED dotplot.
Bank of America Survey referenced.

